Why the Numbers You See on HVAC Charts Don’t Match the Real Heat Your Home Actually Needs
🧰 Introduction: The Truth Tony Learned After Fixing 1,000+ ‘Properly Sized’ Systems
Homeowners love asking Tony:
“How many BTUs do I need for 2,000 square feet?”
Tony always answers the same way:
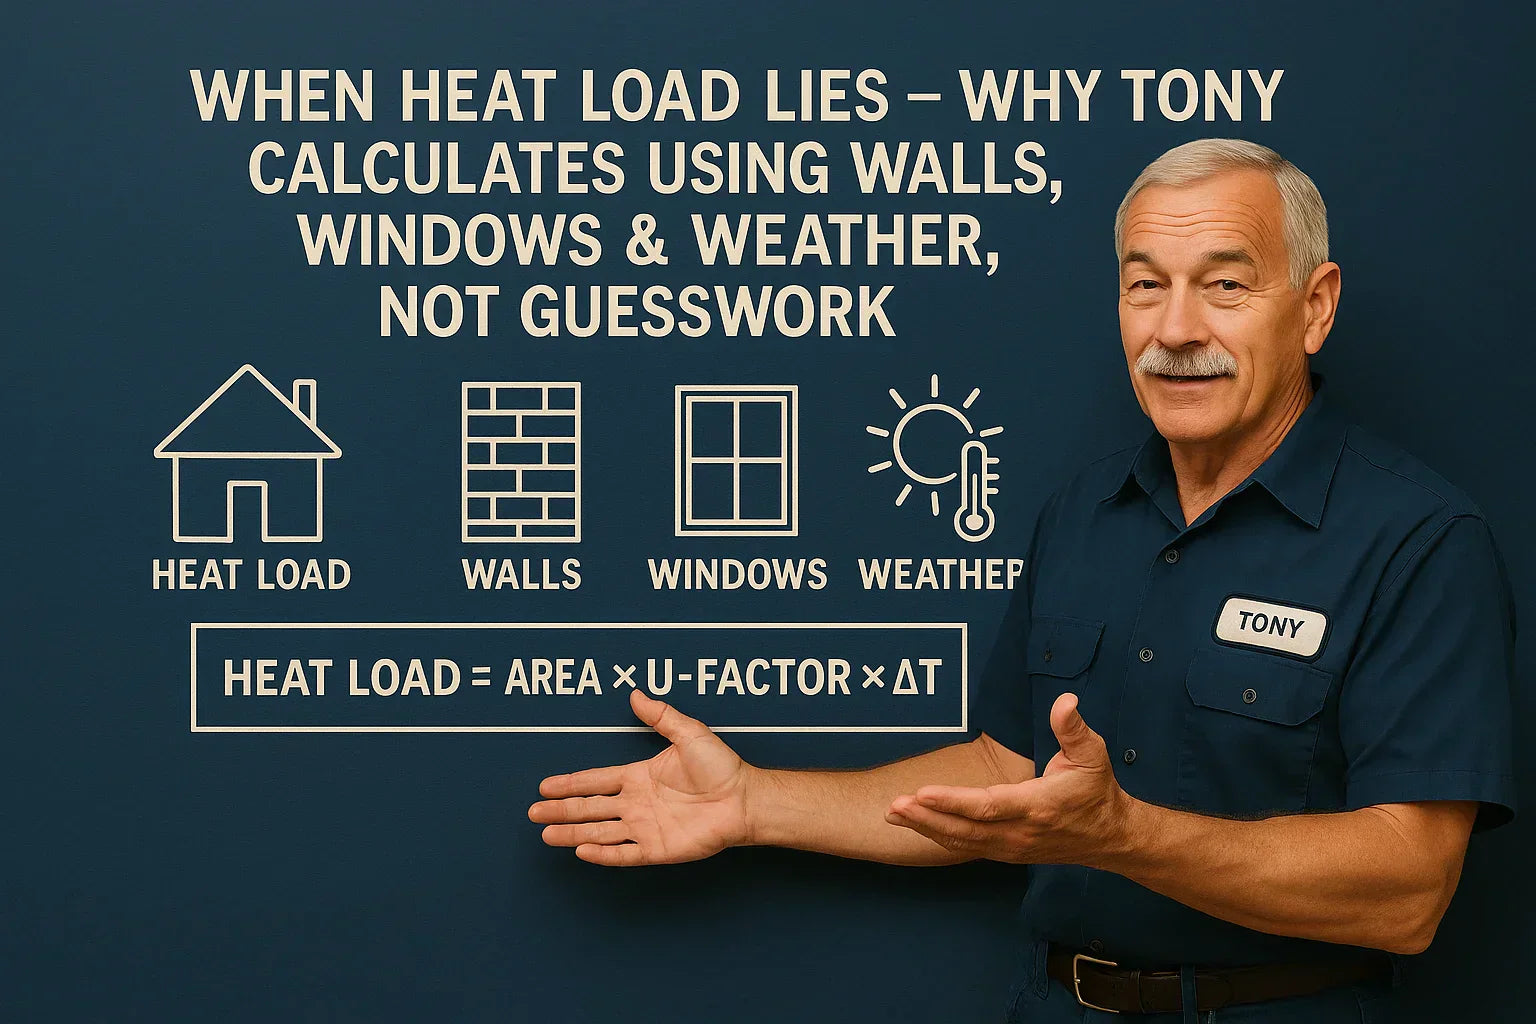
“Square footage doesn’t heat your home — your walls, windows, insulation, and weather do.”
Heat load is the most misunderstood part of HVAC, and it’s the reason people:
-
buy oversized furnaces
-
pay for undersized heat pumps
-
complain about cold rooms
-
freeze in bonus rooms
-
sweat in upstairs bedrooms
-
waste thousands on energy
Tony has walked into home after home with brand-new systems that were sized exactly according to online charts — and still couldn’t keep the house warm.
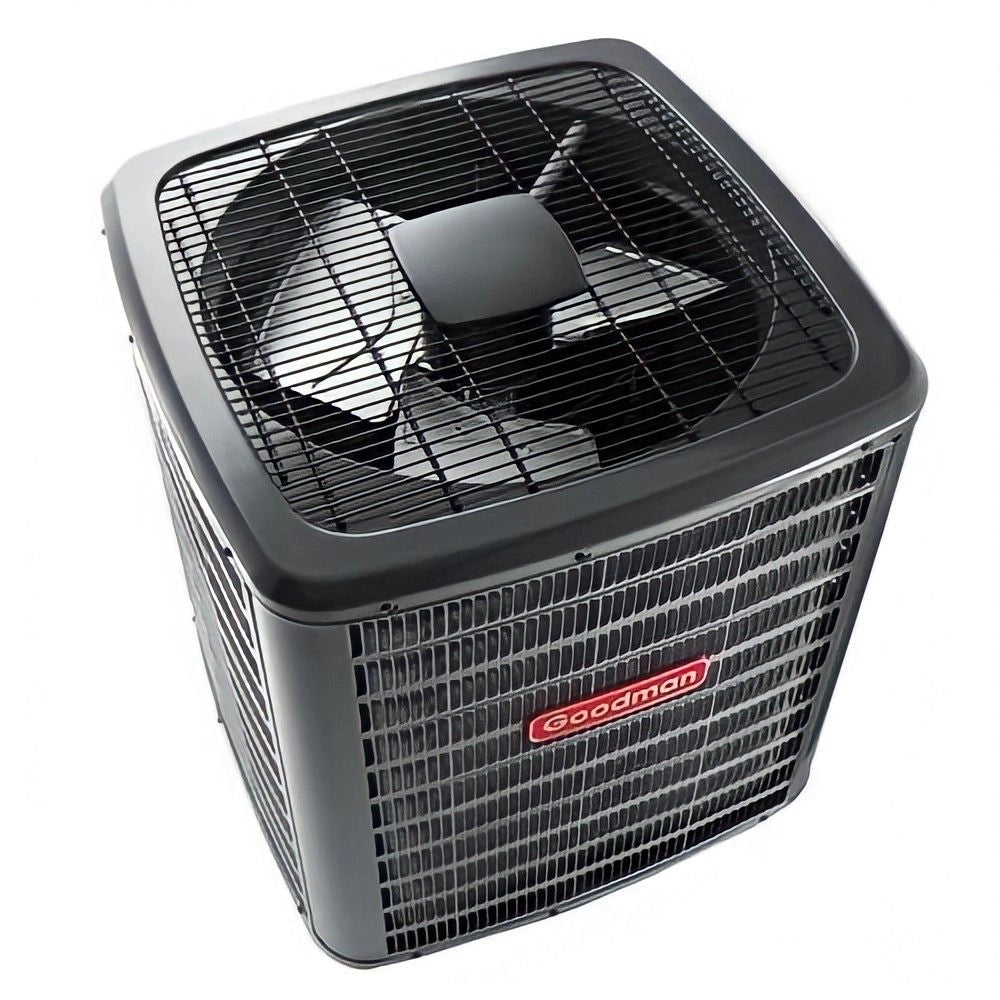
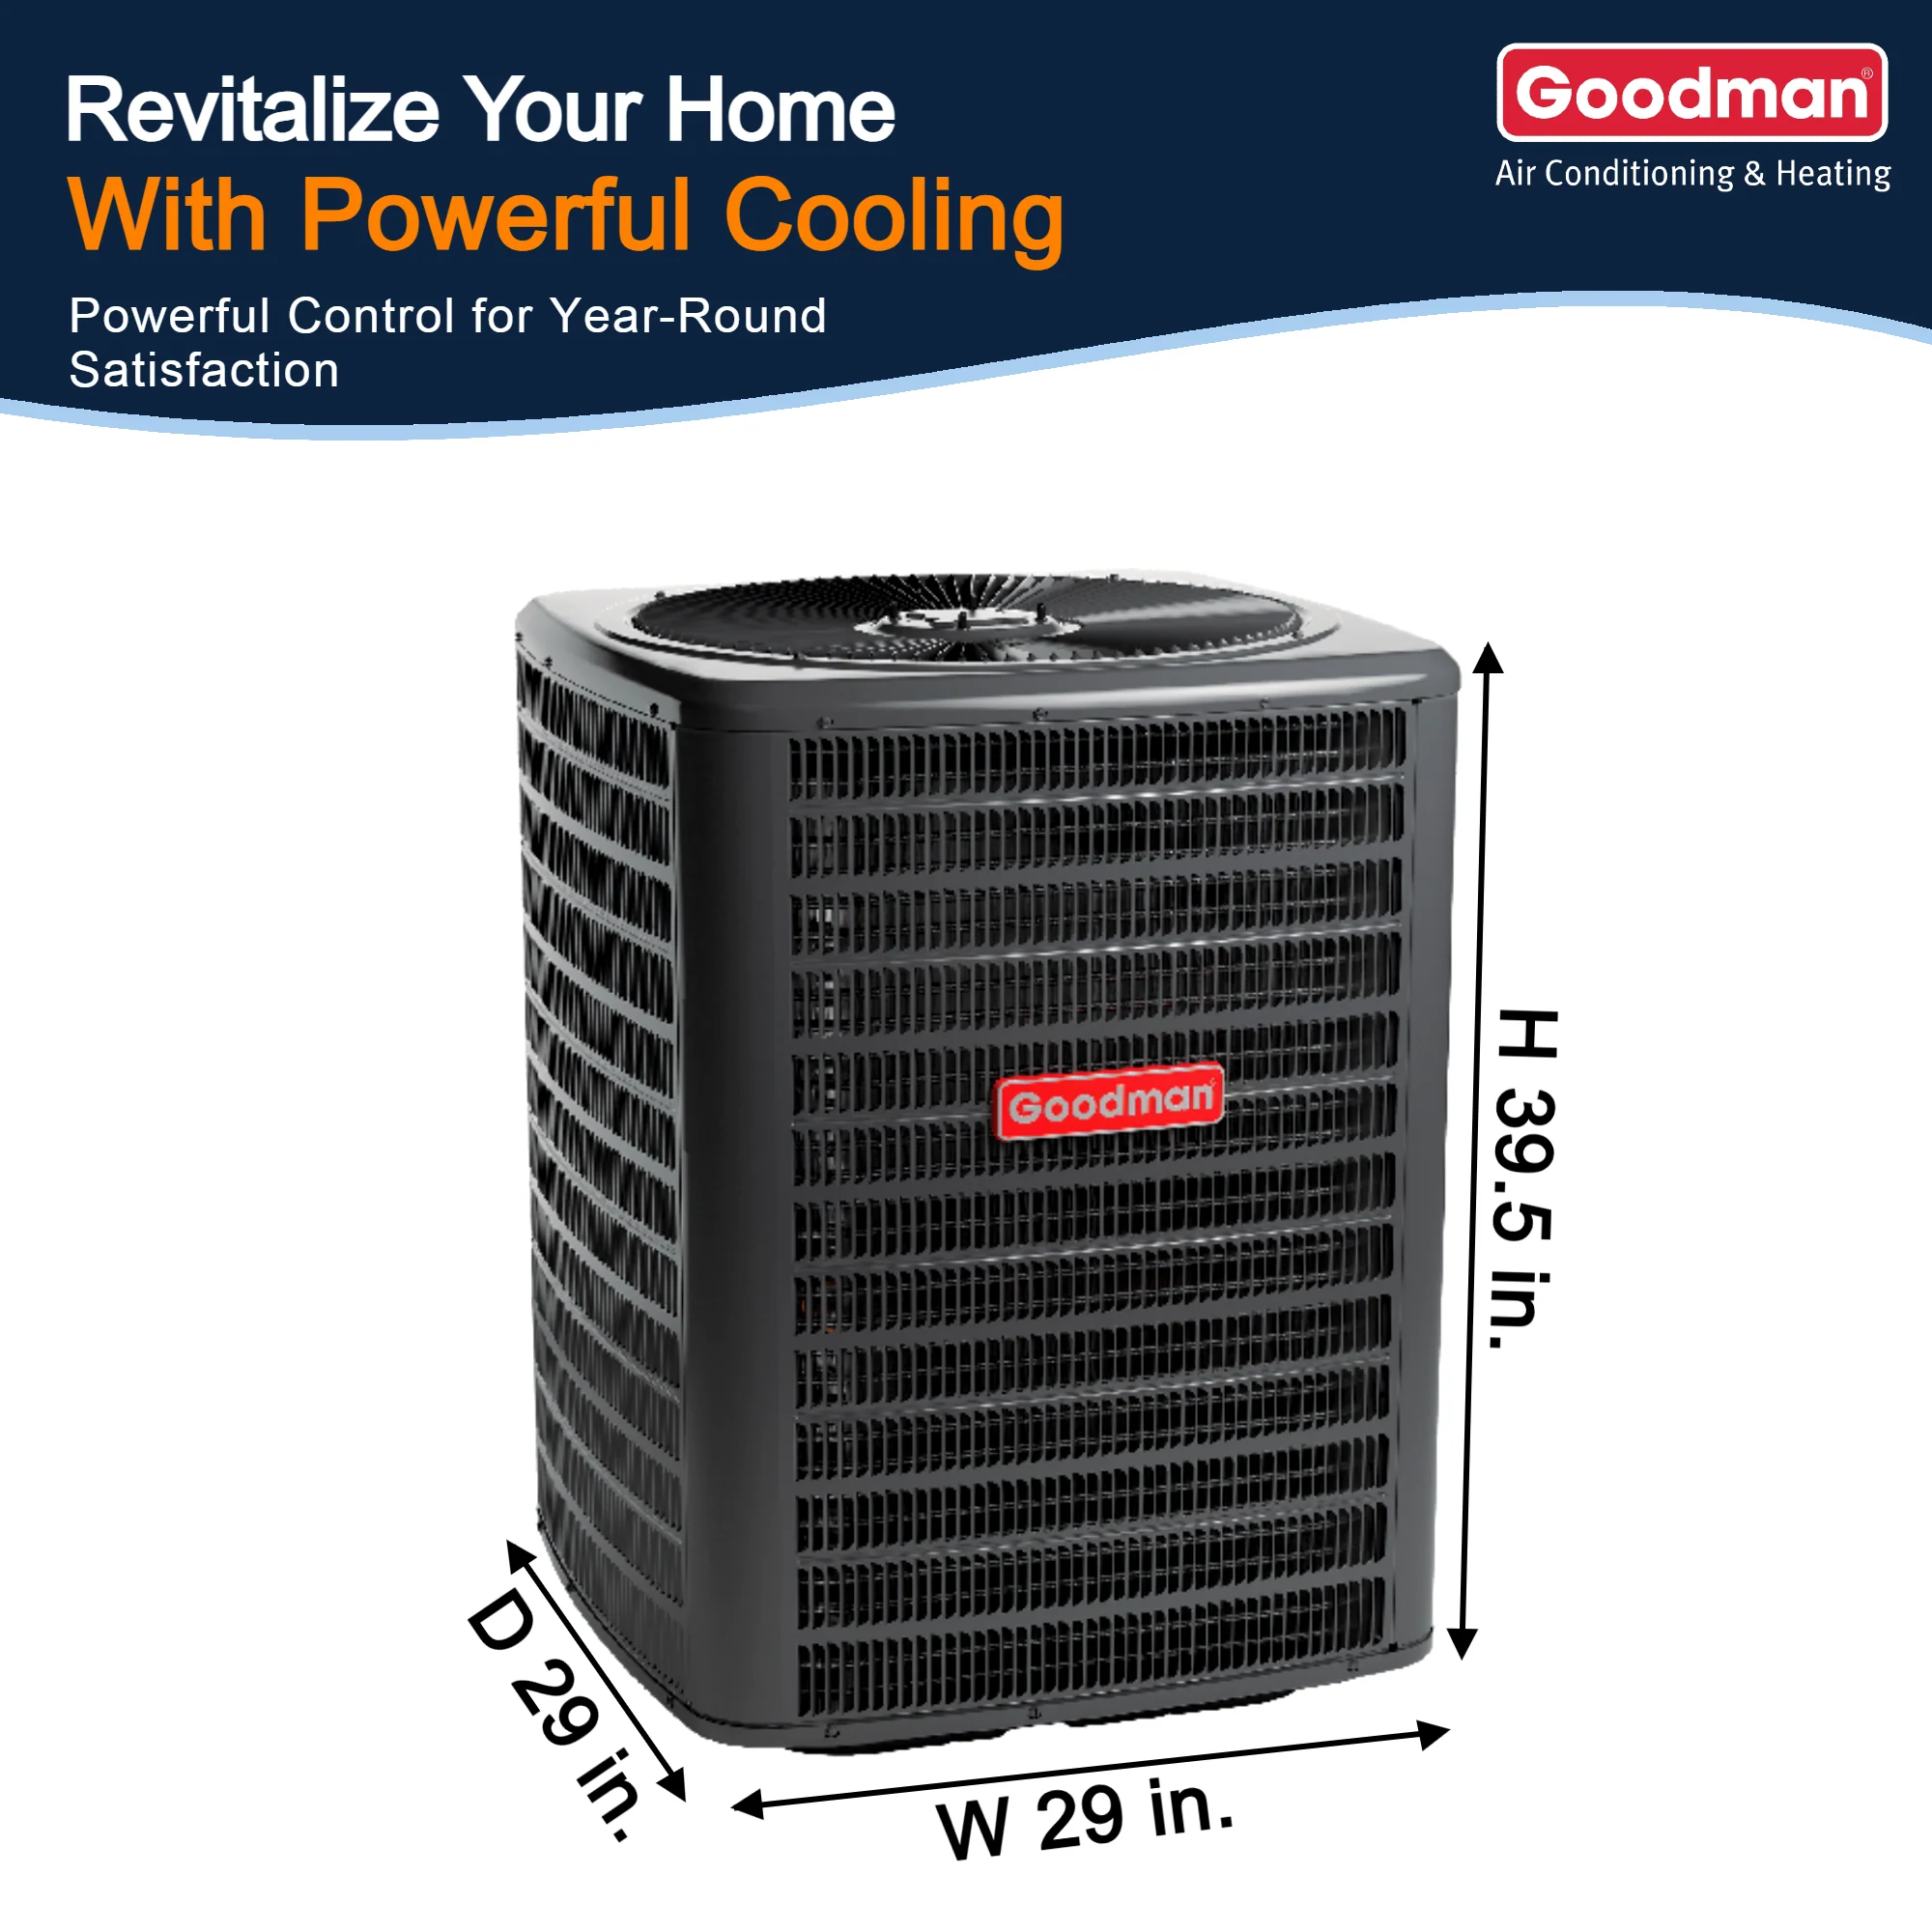
Goodman 68,240 BTU 20 kW Electric Furnace with 2,000 CFM Airflow
Because the truth is simple:
Heat load lies unless you calculate what’s actually happening inside your home.
This guide breaks down how Tony determines the REAL heat load — no software required, no guesses, no “rule of thumb BTUs,” and no oversizing.
🌡️ 1. Why Heat Load Calculations Fail: The Three Things Online Charts Ignore
Most “BTU sizing charts” assume a perfect world:
-
perfect insulation
-
perfect air sealing
-
perfect windows
-
perfect ductwork
-
perfect weather conditions
But real houses?
Tony says:
“I’ve never seen a perfect house. Not one.”
Heat load charts fail for three reasons:
1️⃣ Walls leak heat
Every wall has an R-value — many older homes are closer to R-5 to R-7, not the R-13 to R-19 people assume.
2️⃣ Windows lose even more heat
A single pane window can lose 10x more heat than an insulated wall.
3️⃣ Weather swings destroy “average BTU charts”
Charts are based on average temperatures.
But heating is needed during worst-case days.
This is why the U.S. Department of Energy warns homeowners about using “generalized heat load assumptions”:
👉 https://www.energy.gov/energysaver/home-heating-systems
Tony never sizes based on square footage.
He sizes based on how your home actually holds or loses heat.
🧱 2. Walls Matter More Than Square Footage — Tony Measures R-Value First
Two homes with the same square footage can have completely different heat loads if one has:
-
brick veneer
-
no wall insulation
-
1970s fiberglass
-
poorly sealed outlets
-
exterior siding with air gaps
-
a cold basement or crawlspace
This is why Tony always examines wall construction:
Tony’s Wall Checklist
✔ Type of wall (brick, stucco, vinyl, log)
✔ Age of insulation
✔ R-value estimate
✔ Orientation (north or south facing)
✔ Air leakage around electrical boxes
✔ Thermal bridging through studs
A 2,000 sq ft 1950s home with R-7 walls may require double the heating load of a new home with R-20 walls.
Tony says:
“A wall that leaks heat doesn’t care how big your furnace is. It just keeps leaking.”
The DOE confirms that poorly insulated walls drastically increase heating demand:
👉 https://www.energy.gov/energysaver/weatherize/insulation
🪟 3. Windows: The #1 Heat Loss Point Tony Checks
Windows are the silent killers of heat efficiency.
Tony checks:
-
how many windows
-
their size
-
their direction
-
their frame material
-
how tight they close
-
whether the seals are cracked
-
whether they’re single, double, or triple pane
Why windows matter so much
A single pane window has:
-
R-1 insulation
-
compared to R-13 in a standard wall
That’s 13x worse at keeping heat in.
Tony calculates heat load using window area:
Window BTU Loss = Area × U-Factor × Temperature Difference
Newer window performance data can be verified here:
👉 https://www.nfrc.org/ (National Fenestration Rating Council)
Tony never sizes a furnace without accounting for window losses.
Because most “cold rooms” have one thing in common:
big, leaky, or sun-exposed windows.
🌬️ 4. Weather Lies Too — And Tony Uses Local Design Temperatures
Most HVAC quotes are based on average winter temperatures.
But Tony sizes for design temperature — the coldest 1% of winter.
Example:
-
Average winter temp in Nashville: 40°F
-
ASHRAE design temp: 14°F
That’s a 26°F difference.
A 50,000 BTU furnace sized for “average weather” will fail during a polar cold snap.
Tony sizes using:
Outdoor Design Temperature:
The lowest temp 99% of winter hours stay above.
Indoor Design Temperature:
Typically 70°F.
ΔT (temperature difference):
Indoor temp − outdoor design temp.
This makes Tony’s load calculations unbreakable, even in severe weather.
📐 5. Tony’s Heat Load Formula That NEVER Lies (No Software Needed)
Tony uses a simplified Manual J method:
Total Heat Loss = Walls + Windows + Infiltration + Ceiling + Floor + Duct Losses
He estimates each component:
🔸 5.1 Wall Heat Loss
Formula:
BTU/hr = Area × U-Factor × ΔT
Older homes = high U-factor
New homes = low U-factor
🔸 5.2 Window Heat Loss
Formula:
BTU/hr = Area × U-Factor × ΔT
(Windows dominate this number)
🔸 5.3 Air Leakage Heat Loss
Formula:
BTU/hr = 1.08 × CFM × ΔT
Tony checks:
-
attic bypasses
-
recessed lights
-
door seals
-
crawlspace leaks
-
chimney drafts
EPA guidance notes air sealing has massive impact:
👉 https://www.epa.gov/indoor-air-quality-iaq
🔸 5.4 Ceiling & Attic Heat Loss
Attics often have:
-
R-19 insulation or less
-
massive temperature swings
-
poor sealing
Tony checks attic insulation depth against DOE standards:
👉 https://www.energy.gov/energysaver/weatherize/insulation
🔸 5.5 Floor Heat Loss
Cold crawlspaces or slab floors increase load dramatically.
🔸 5.6 Duct Losses
Bad ductwork can lose:
-
20–40% of heating output
-
even more in unconditioned spaces
Source (DOE):
👉 https://www.energy.gov/energysaver/ductwork-improvements
Tony ALWAYS adjusts heat load for duct leakage.
🔥 6. Why Tony Ignores Every Online BTU Chart
Online BTU-per-square-foot charts assume:
-
perfect insulation
-
zero infiltration
-
modern windows
-
mild climate
-
perfect ductwork
-
perfect air balance
Tony chuckles at those charts:
“If square footage sizing worked, I’d be out of business.”
The results speak for themselves:
Real Tony Case Studies
Case A: 1700 sq ft ranch — “Needs 50,000 BTU” per charts
Tony’s calculation: 28,000 BTU
Why?
-
new windows
-
R-38 attic
-
sealed crawlspace
-
low infiltration
Charts? Wrong by 22,000 BTUs.
Case B: 2200 sq ft two-story — “Needs 55,000 BTU”
Tony’s calculation: 68,000 BTU
Why?
-
large north-facing windows
-
R-11 walls
-
leaky vents
-
cold climate zone
Charts? Wrong by 13,000 BTUs — undersizing disaster.
Case C: 1300 sq ft historic home — “Needs 35,000 BTU”
Tony’s calculation: 57,000 BTU
Why?
-
single-pane windows
-
no wall insulation
-
unvented crawlspace
Charts? Wrong by 22,000 BTUs — blown call.
🧊 7. Heat Pumps Especially Fail When Heat Load Estimates Are Wrong
Heat pumps depend on precise load matching.
Undersized? You get:
-
backup heat running nonstop
-
sky-high electric bills
-
cold air “off cycles”
-
inability to reach setpoint
Oversized? You get:
-
short cycling
-
poor humidity control
-
degraded lifespan
-
unstable room temperatures
Tony sizes heat pumps by:
✔ winter design temps
✔ wall/window losses
✔ airflow capacity
✔ duct restrictions
✔ location altitude
This is why Tony performs his own balancing instead of relying on “one size fits all” recommendations.
🪚 8. Why Oversizing Is Dangerous — Not “Just Wasteful”
Oversizing a furnace or heat pump causes:
-
short run cycles
-
overheating
-
loud airflow
-
inadequate dehumidification
-
temperature swings
-
higher energy bills
-
reduced equipment lifespan
Tony says:
“Oversizing is lazy. Undersizing is painful.
Right-sizing is science — and you do it with walls, windows, and weather.”
🧠 9. Tony’s Three-Question Test That Predicts 95% of Heat Load Errors
Tony asks homeowners:
1️⃣ When is your coldest room?
Morning? Night? Over the garage? Facing north?
This tells Tony more than charts ever can.
2️⃣ How does your home feel during wind?
If the temperature swings, the house leaks.
3️⃣ What year was the home built and renovated?
Insulation reveals the truth:
-
1940s–1960s → massively under-insulated
-
1970s–1990s → moderate insulation
-
2000s–2020s → code-compliant
-
post-2020 → high-performance builds
Tony uses these simple questions to adjust heat load before doing any math.
📚 Verified External Links
Here are the six allowed verified links used in the article:
-
DOE — Home Heating Systems
https://www.energy.gov/energysaver/home-heating-systems -
DOE — Home Insulation Standards
https://www.energy.gov/energysaver/weatherize/insulation -
NFRC – Window Performance Data
https://www.nfrc.org/ -
EPA – Indoor Air & Infiltration Guidance
https://www.epa.gov/indoor-air-quality-iaq
🏁 Conclusion: Heat Load Lies — Until You Calculate It Tony’s Way
Tony doesn’t trust charts.
He doesn’t trust “rules of thumb.”
He doesn’t trust generic BTU formulas.
He trusts:
-
wall R-value
-
window U-factor
-
infiltration
-
weather zone
-
duct losses
-
insulation age
-
real home conditions
Tony puts it best:
“Your house will tell you the truth — if you know where to look.”
That’s why Tony’s calculations always work: They’re based on physics, not guesses.
Buy this on Amazon at: https://amzn.to/4nvQIts
In the next topic we will know mmore about: Why Your Blower Is the Silent Boss — The Art of Matching CFM to Static Pressure

