For decades, HVAC sizing has been based on formulas, experience, and educated guesses.
Manual J calculations help, square footage gives us a starting point, and climate zones tell us a lot about heat load… but none of them reveal the full truth:
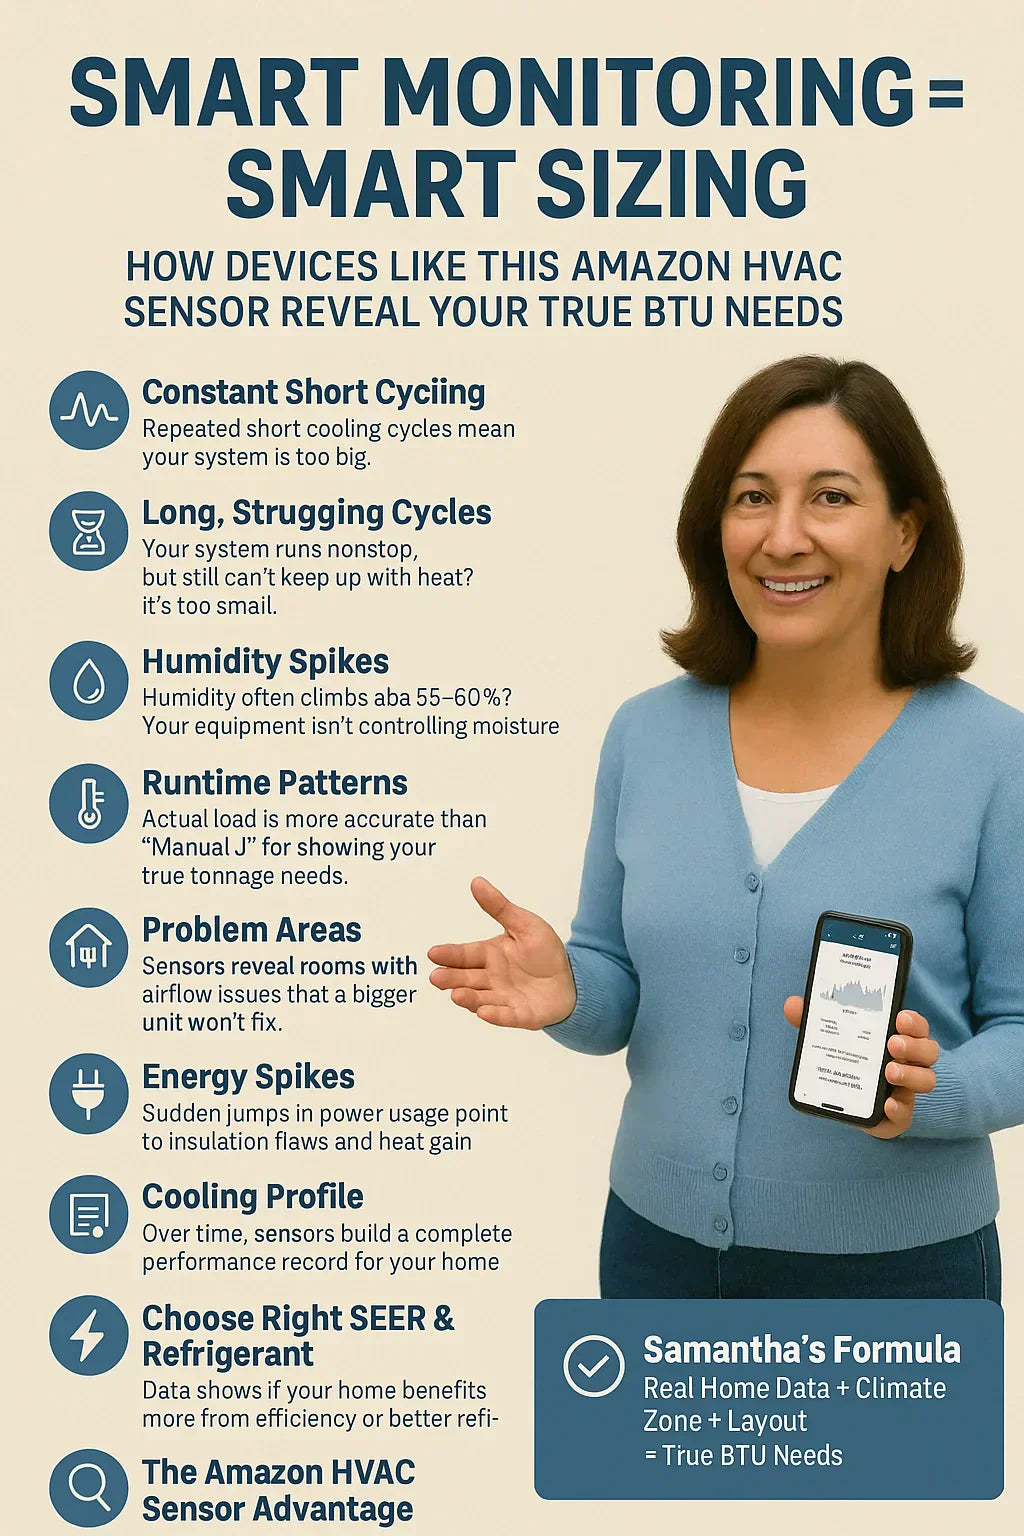
Your home’s real BTU needs can now be measured in real time — automatically — using smart HVAC monitoring tools.
And that’s a revolution for homeowners.
Today, devices can show you:
-
How long your AC runs
-
When it shuts off
-
If it’s short cycling
-
How quickly temperatures rise
-
How humidity behaves
-
Whether your ducts are restricting airflow
-
How efficiently your compressor operates
-
Whether your system is oversized or undersized
This is information homeowners have never had before.
In this guide, I’m going to walk you through exactly how smart sensors turn complicated HVAC sizing into simple facts, and how they reveal the true BTU load your home actually demands — not the theoretical one.
📏 1. The Problem With Traditional Sizing: We’ve Been Estimating for 40+ Years
Before smart monitoring, HVAC sizing relied on:
-
Contractor experience
-
Rule-of-thumb charts
-
Square footage
-
Climate zone assumptions
-
Manual J load calculations
-
Home walkthroughs
-
Infrared readings
-
Duct inspections
All of these methods are important — but they still only estimate what your home should need.
They don’t measure what your home really needs, because they cannot see:
-
How sunlight hits your home each afternoon
-
How fast indoor temperatures rise when no one is home
-
How efficiently your insulation holds overnight
-
How humidity builds during rainy spells
-
How quickly your AC recovers after setback
-
How airflow changes when doors are open or closed
-
How attic heat impacts runtime
-
How ducts leak or lose pressure in real weather conditions
The U.S. Department of Energy’s guidance shows why these assumptions often fall short:
🔗 https://www.energy.gov/energysaver/central-air-conditioning
But now, smart HVAC sensors give us actual data from your home — not estimates.
📉 2. The #1 Thing Smart Sensors Reveal: Short Cycling (Oversized System)
Short cycling is when your air conditioner:
-
Turns on
-
Runs briefly
-
Turns off
-
Turns on again minutes later
A smart sensor captures this pattern with minute-by-minute diagnostics.
Why this matters:
Short cycling means your AC is too big.
And oversized systems cause:
-
Poor humidity removal
-
Clammy air
-
Hot spots
-
Higher electricity bills
-
Excessive compressor wear
-
Loud, frequent starts and stops
-
Poor temperature stability
The EPA explains how humidity control is essential to indoor comfort:
🔗 https://www.epa.gov/mold/mold-course-chapter-2
If your sensor shows repeated short cycles, it’s not a thermostat problem.
Not a duct problem.
Not an airflow problem.
It’s almost always oversizing.
And that affects comfort far more than most homeowners realize.
⏳ 3. Long Run Cycles Reveal the Opposite: An Undersized System
On the flip side, if your smart monitoring device shows:
-
Very long AC cycles
-
Or cycles that don’t end
-
Or cycles that barely reach your setpoint
…it means your system is likely too small for your true heat load.
An undersized system struggles to:
-
Cool during high heat
-
Maintain comfort upstairs
-
Remove humidity effectively
-
Offset poor insulation
-
Overcome solar heat gain
A smart sensor shows this clearly because you’ll see:
-
Runtime bars extending longer than normal
-
High afternoon workload
-
Rising humidity during peak heat
-
A system that never gets “quiet time” to rest
This is especially common in:
-
Two-story homes
-
Older homes
-
Homes with lots of windows
-
Homes with dark roofs
-
Homes with poor attic ventilation
A load calculation helps you estimate —
but smart sensors show exactly what happens during heat waves.
💧 4. Humidity Data = The Secret Key to Proper Sizing
Humidity is the most overlooked piece of sizing.
Homeowners often assume:
“If the temperature feels cool, the AC is working.”
Wrong.
High humidity can make a 72°F home feel like 78–80°F.
Smart sensors track:
-
Relative humidity
-
Dew point
-
System dehumidification performance
-
Coil temperature trends
-
Moisture load patterns
-
How humidity changes throughout the day
If humidity rises above 55–60% consistently, your sensor will show:
-
Your AC isn’t running long enough (oversized)
-
Your AC is running too long (undersized)
-
Your ductwork isn’t balanced
-
Your home leaks humid air
-
Your heat load exceeds system BTU capacity
This is one of the most powerful insights smart monitoring provides.
Because proper humidity removal is as important as cooling, and it dramatically impacts sizing decisions.
🌬️ 5. Smart Sensors Track Airflow Inconsistencies You Can’t See
Most homeowners don’t know whether they have:
-
Undersized ducts
-
Restricted branches
-
Leaking trunk lines
-
Kinked flex duct
-
Low static pressure
-
Improper return sizing
-
Closed or misbalanced dampers
Smart sensors don’t measure duct pressure directly (some specialized sensors do), but they measure runtime behavior that exposes airflow issues, such as:
-
Rooms cooling at different rates
-
System cooling quickly but warming quickly
-
Longer runtime on one floor
-
Weak airflow during peak afternoon heat
-
Excessive blower activity
-
Slow recovery after setback
-
Air handler temperature swings
This data helps determine whether a system appears undersized when the real problem is duct constriction — which requires duct optimization, not more tonnage.
📈 6. Smart Monitoring Reveals Heat Gain Patterns (The True BTU Load)
Every home has a unique heat gain fingerprint, based on:
-
Sun exposure
-
Windows
-
Roof color
-
Attic insulation
-
Ceiling height
-
Duct design
-
Wall construction
-
Occupancy
-
Cooking patterns
-
Internal heat sources
-
Climate zone
Smart sensors show:
-
What time of day your home gains the most heat
-
Which rooms warm up fastest
-
Where sun exposure hits hardest
-
How quickly interior temperatures rise when the system is off
This is data that no Manual J — no matter how detailed — can perfectly represent.
The DOE provides heat gain factors for windows and roofs
Smart monitoring shows how these factors behave in your home.
🔌 7. Energy Usage Patterns Reveal System Health and True Load
Smart sensors track:
-
Blower motor energy
-
Compressor energy
-
Runtime vs wattage
-
Heat wave energy spikes
-
Inefficient cycles
-
Long recovery periods
-
Irregular consumption patterns
Energy spikes typically mean:
-
Extremely high solar heat gain
-
Attic insulation weakness
-
Undersized system
-
Refrigerant imbalance
-
Duct leakage
-
Blower speed improperly set
Energy dips may mean:
-
Oversized system
-
Short cycling
-
System turning off too soon
-
Poor humidity removal
These patterns help determine:
-
Whether you need more BTUs
-
Whether you need fewer BTUs
-
Whether you need better airflow
-
Whether your home needs envelope improvements
-
Whether you’re a good candidate for R-32 systems
📊 8. Daily & Seasonal Monitoring: The Most Accurate Sizing Tool Ever Invented
Traditional sizing relies on predicted heat loads.
Smart monitoring uses actual measured behavior over:
-
Hot days
-
Humid days
-
Cloudy days
-
Cool days
-
High-wind days
-
Rainy days
-
Peeak heat waves
-
Real occupancy patterns
Patterns like:
Morning Patterns (7–10 AM)
-
Hot bedrooms upstairs
-
East-facing windows warming early
-
Slow cooling recovery
Afternoon Patterns (2–6 PM)
-
West-facing windows causing BTU spikes
-
Dark roof loading attic
-
High humidity load
Evening Patterns (6–10 PM)
-
Lingering heat in second-floor air
-
Kitchen heat load from cooking
-
Air stagnation in main living areas
This gives a complete picture of:
-
True cooling load
-
True humidity load
-
Real heat gain cycles
-
Real airflow balance
-
Real BTU requirements
This is the most accurate HVAC sizing information homeowners have ever had access to.
🔥 9. Smart Monitoring + Climate Zone = The Perfect BTU Formula
Once you understand real performance data, you combine it with:
✔ Climate zone
DOE map:
🔗 https://www.energycodes.gov/determinations
✔ Home insulation
✔ Window gain
✔ Occupancy
✔ System efficiency
✔ Duct design
✔ Refrigerant performance (R-32 vs R-410A)
This reveals exactly how many BTUs your home needs.
Examples:
-
A 2,000 sq. ft. home in Phoenix might need 5 tons
-
A 2,000 sq. ft. home in Seattle might need 2–2.5 tons
-
A 2,000 sq. ft. home in Atlanta might need 3.5–4 tons
-
A 2,000 sq. ft. home in Denver might need 2.5–3 tons
Smart monitoring reveals why these patterns occur — with proof.
🧊 10. Smart Monitoring Helps You Decide Between Tonnage vs Efficiency
Example:
Should I buy a 3-ton or a 3.5-ton system?
Smart monitoring will show:
-
Runtime length
-
Peak afternoon cooling demand
-
Humidity control
-
Time to reach setpoint
-
Temperature rebound
-
Whether system cycles are healthy
Sometimes:
-
You don’t need more tonnage — you need better ducts
-
You don’t need more tonnage — you need window film
-
You don’t need more tonnage — you need R-32 refrigerant
-
You don’t need more tonnage — you just need static pressure correction
Smart sensors tell you.
⚙️ 11. How Smart Sensors Help Detect Refrigerant Efficiency Differences (R-32 vs. R-410A)
You already know from previous articles that:
-
R-32 carries heat better
-
R-32 cools faster
-
R-32 maintains BTUs at high temps
-
R-410A struggles in extreme heat
Smart sensors reveal this in real time:
R-410A behavior in heat waves:
-
Longer cycles
-
Higher watt draw
-
Slower recovery
-
Rising humidity
-
Sometimes failing to reach setpoint
R-32 behavior in heat waves:
-
Shorter cycles
-
Better dehumidification
-
Lower energy use
-
Stronger high-temp performance
EPA guidance on refrigerant transition:
🔗 https://www.epa.gov/ods-phaseout
This means smart sensors help homeowners choose the right refrigerant technology too — not just tonnage.
🔍 12. Why Smart Monitoring Reveals Problems Manual J Can’t See
Manual J examines theoretical heat loads.
Smart monitoring reveals:
-
Actual home performance
-
Actual BTU demand
-
Actual airflow behavior
-
Actual humidity patterns
This exposes real problems like:
-
High afternoon temperature spikes
-
Rooms that freeze while others bake
-
Duct losses
-
Inconsistent airflow
-
Attic-driven heat imbalance
-
Solar-driven load surges
No formula can replicate this.
🏠 13. How Homeowners Should Use Smart Monitoring Before Choosing Their Next System
Samantha’s recommended approach:
Step 1 — Install your smart monitor
Plug in the smart HVAC monitoring sensor (Amazon link you provided).
Step 2 — Collect at least 5 days of data
More is better — especially during:
-
Hot days
-
Cloudy days
-
Humid days
-
Morning cool-down
-
Afternoon warm-up
-
High-occupancy times
Step 3 — Review patterns
Look for:
-
Long cycles
-
Short cycles
-
Fast heat gain
-
Slow heat gain
-
High humidity
-
Temperature imbalance
-
Afternoon spikes
-
Nighttime drops
Step 4 — Compare data to climate zone expectations
Climate insights = context.
Step 5 — Determine real BTU needs
Smart monitoring tells you what tonnage your home actually uses, not just what charts suggest.
📦 14. Example: What Smart Monitoring Reveals for Real Homes
Let’s walk through scenarios.
Scenario A: 2,000 sq. ft. two-story home in Florida
Smart sensor shows:
-
Short cycles
-
High humidity
-
Quick cool, quick warm
-
Afternoon humidity spikes
Diagnosis:
Oversized system.
Solution:
Downsize tonnage or improve duct/airflow.
Scenario B: 2,500 sq. ft. ranch in Texas
Smart sensor shows:
-
Very long cycles
-
High afternoon attic heat
-
Stable humidity
Diagnosis:
Undersized system OR attic insulation issue.
Scenario C: 1,900 sq. ft. home in Colorado
Smart sensor shows:
-
Very short morning cycles
-
Long afternoon cycles
-
Huge west-facing windows overheating rooms
Diagnosis:
Solar gain problem — not tonnage.
Scenario D: 3,000 sq. ft. home in Tennessee
Smart sensor shows:
-
Strong humidity spikes
-
Slow recovery after cooking
-
Fast cool-down at night
Diagnosis:
Humidity load too high for current tonnage.
Smart sensors make these patterns obvious.
✔ Final Takeaway from Samantha
Smart HVAC monitoring is the missing piece in proper HVAC sizing.
Because for the first time ever, homeowners can see:
-
Real cycles
-
Real heat load
-
Real humidity load
-
Real airflow issues
-
Real efficiency
-
Real energy usage
-
Real BTU demands
Not estimates.
Not assumptions.
Not rule-of-thumb calculations.
Facts.
When you combine smart monitoring + climate zone + home layout, you get the most accurate HVAC sizing possible.
This keeps your next system from being:
-
Too big
-
Too small
-
Too inefficient
-
Too humid
-
Too expensive
Instead — you get perfect sizing, perfect comfort, and the longest system lifespan.
Because your home’s data tells the truth.
Smart sensors simply let you listen.
Buy this on Amazon at: https://amzn.to/47usZUk
In the next topic we will know more about: Ductwork: The Sizing Factor Nobody Talks About — Until Their System Starts Struggling

