🌿 Introduction: The Most Important 15 Minutes of Your System’s Life
Most homeowners think HVAC efficiency is determined by equipment specs — SEER2 ratings, compressor type, blower speed, refrigerant, or duct layout. But Savvy knows there’s one moment that matters more than anything:
The first 15 minutes after startup.
This short window tells you:
-
Whether your refrigerant circuit is healthy
-
Whether airflow is adequate
-
Whether the TXV/EEV is behaving
-
Whether pressures are stable
-
Whether the coil is loading heat correctly
-
Whether the system is tuned for a decade of performance
-
Whether the homeowner will enjoy quiet, consistent comfort — or years of repairs
The “First 15 Minutes” Test is a predictive diagnostic.
Done correctly, it becomes a crystal ball for system longevity.
Let’s walk through it, Savvy-style.
🔌 1. Why the First 15 Minutes Matter More Than Most Homeowners Realize
Icon: ⏱️
Right after startup, the system transitions through several phases:
-
Initial compressor surge
-
Refrigerant pressure equalization
-
Coil saturation
-
Thermal stabilization
-
System equilibrium
If anything goes wrong during these phases, the system may still cool, but it will:
-
Run louder
-
Use more electricity
-
Wear the compressor faster
-
Lose 10–30% of efficiency
-
Suffer from premature failure
The First 15 Minutes Test reveals these hidden problems before they become expensive problems.
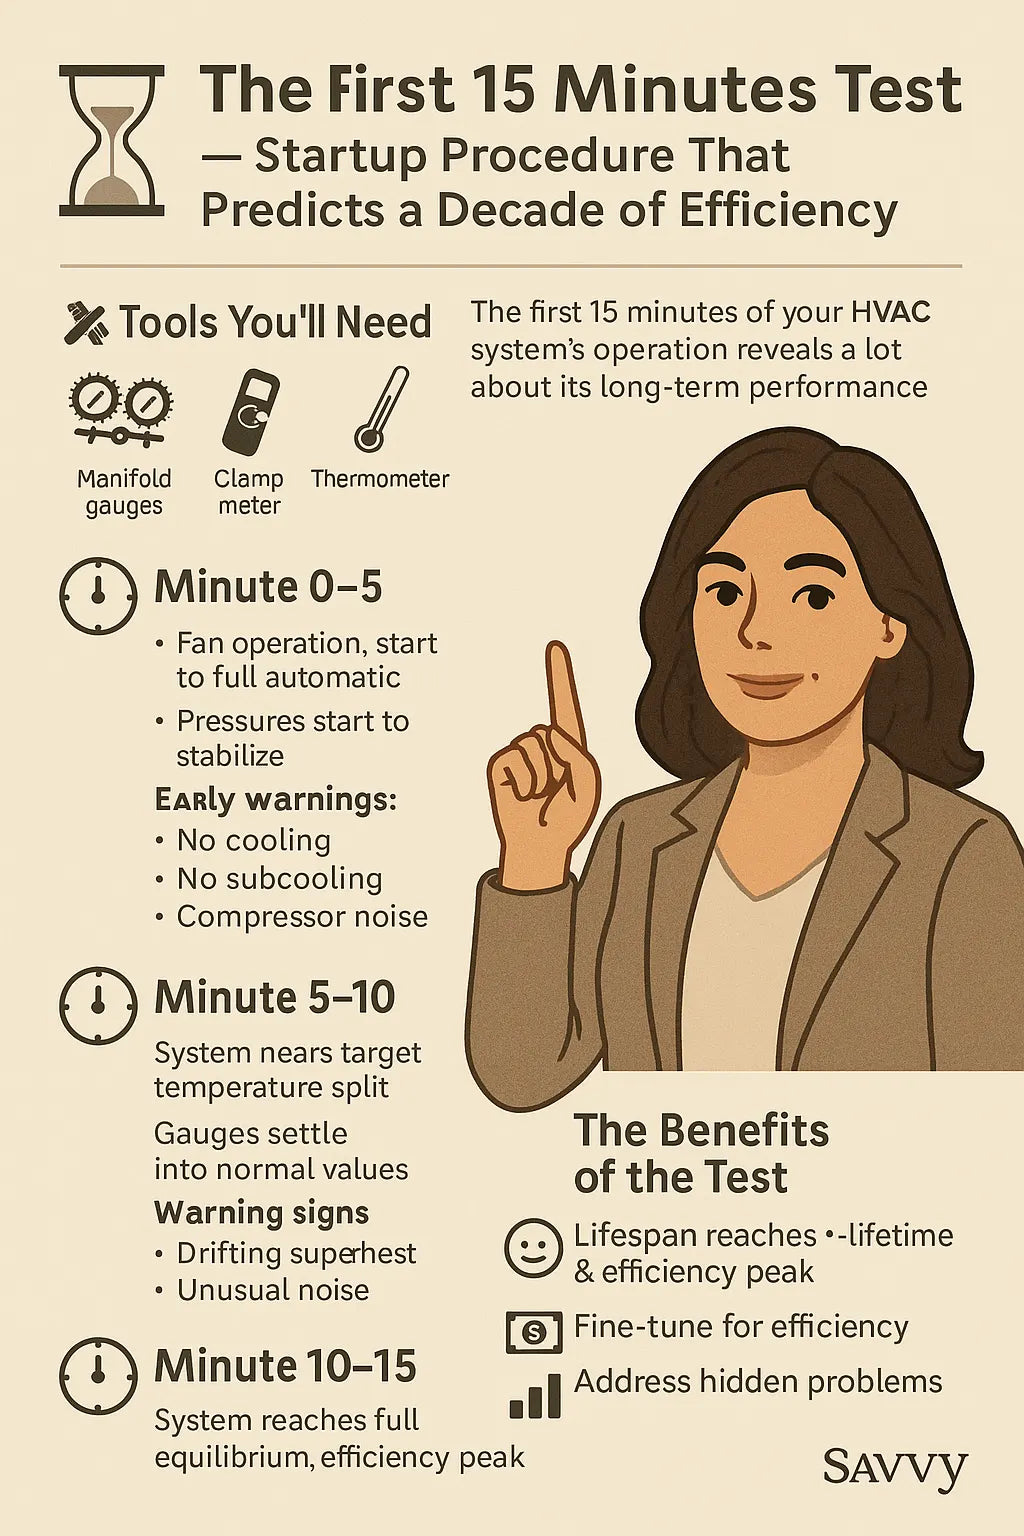
🧠 2. Tools You Need for the Test
Icon: 🧰
A seasoned tech or Savvy homeowner will have:
-
Digital manifold gauges
-
Temperature probes (supply/return/coil lines)
-
Clamp meter (amps)
-
Thermometer or hygrometer
-
Static pressure manometer
-
Anemometer (optional)
-
Smart thermostat with data tracking (highly recommended)
With these tools, you can observe the system’s entire startup behavior.
⚙️ 3. Minute-by-Minute Breakdown — What Should Happen and When
Icon: 📊
Here is the full Savvy diagnostic timeline:
🟩 Minute 0–1: Initial Startup Surge
What Should Happen:
-
Compressor kicks on without hesitation
-
Fan motor ramps smoothly
-
No loud clanking or vibration
-
No unusual humming or buzzing
What You’re Checking:
-
Locked rotor amperage (LRA) not triggered
-
Voltage stable
-
Start capacitor (if used) functioning
Red Flags:
-
Long crank time
-
Clicking
-
High vibration on pad
-
Fan sputtering
This predicts future compressor or capacitor failures.
🟩 Minute 1–3: Pressures Begin to Stabilize
What Should Happen:
-
Suction pressure starts descending
-
Liquid pressure starts rising
-
Subcooling begins to form
-
Superheat begins to settle
Target Values:
(General R-410A/R-32 system — always check manufacturer charts)
| Metric | Expected Range |
|---|---|
| Suction Pressure | 110–140 psi (R-410A) |
| Liquid Pressure | 350–425 psi |
| Subcooling | 8–14°F |
| Superheat | 8–20°F |
Red Flags:
-
Flatlined pressures
-
Wild fluctuations
-
Extremely high head pressure
-
No subcooling after 2–3 minutes
This stage predicts refrigeration-side issues like charge problems or TXV malfunction.
🟩 Minute 3–5: Coil Saturation Phase
What Should Happen:
-
Indoor coil achieves full thermal load
-
Return air temperature begins dropping
-
Supply air temperature stabilizes
-
Condenser fan exhaust becomes warmer
Target Values:
-
15–22°F temperature split typically ideal
-
Supply temp often 55–60°F under normal humidity
Red Flags:
-
Weak temperature split
-
No noticeable cooling
-
Coil freeze-up
-
Excess sweating on suction line
This phase predicts airflow issues or refrigerant mischarge.
🟩 Minute 5–10: System Approaches Steady-State Operation
What Should Happen:
-
Pressures steady, non-fluctuating
-
Subcool/superheat settle into target range
-
Fan noise levels consistent
-
Thermostat begins learning cycle behavior
Red Flags:
-
Rising amp draw
-
Excessive noise
-
Sweating compressor
-
Suction line below 32°F
-
Condenser fan blowing cold or lukewarm air
This stage predicts long-term compressor health.
🟩 Minute 10–15: Full Equilibrium Reached
What Should Happen:
-
System efficiency peaks
-
Temperature split remains constant
-
Refrigerant circuit fully saturated
-
Coil moisture removal becomes stable
-
Compressor amperage normalizes
Red Flags:
-
Temperature split drifting downward
-
Humidity not dropping
-
Amp draw creeping upward
-
Subcool drifting continuously
-
Low or unstable airflow
Minute 15 predicts the next 10 years of your system’s performance.
If the system behaves well here, it will behave well long-term.
🌬️ 4. Airflow Testing During the First 15 Minutes
Icon: 🌪️
Airflow is the hidden backbone of efficiency.
Tests to Perform:
1. Static Pressure Test
Target:
≤ 0.5" WC total external static
High static =
-
Noisy operation
-
Low efficiency
-
Coil freeze-up risk
2. CFM Measurement
General rule:
350–400 CFM per ton
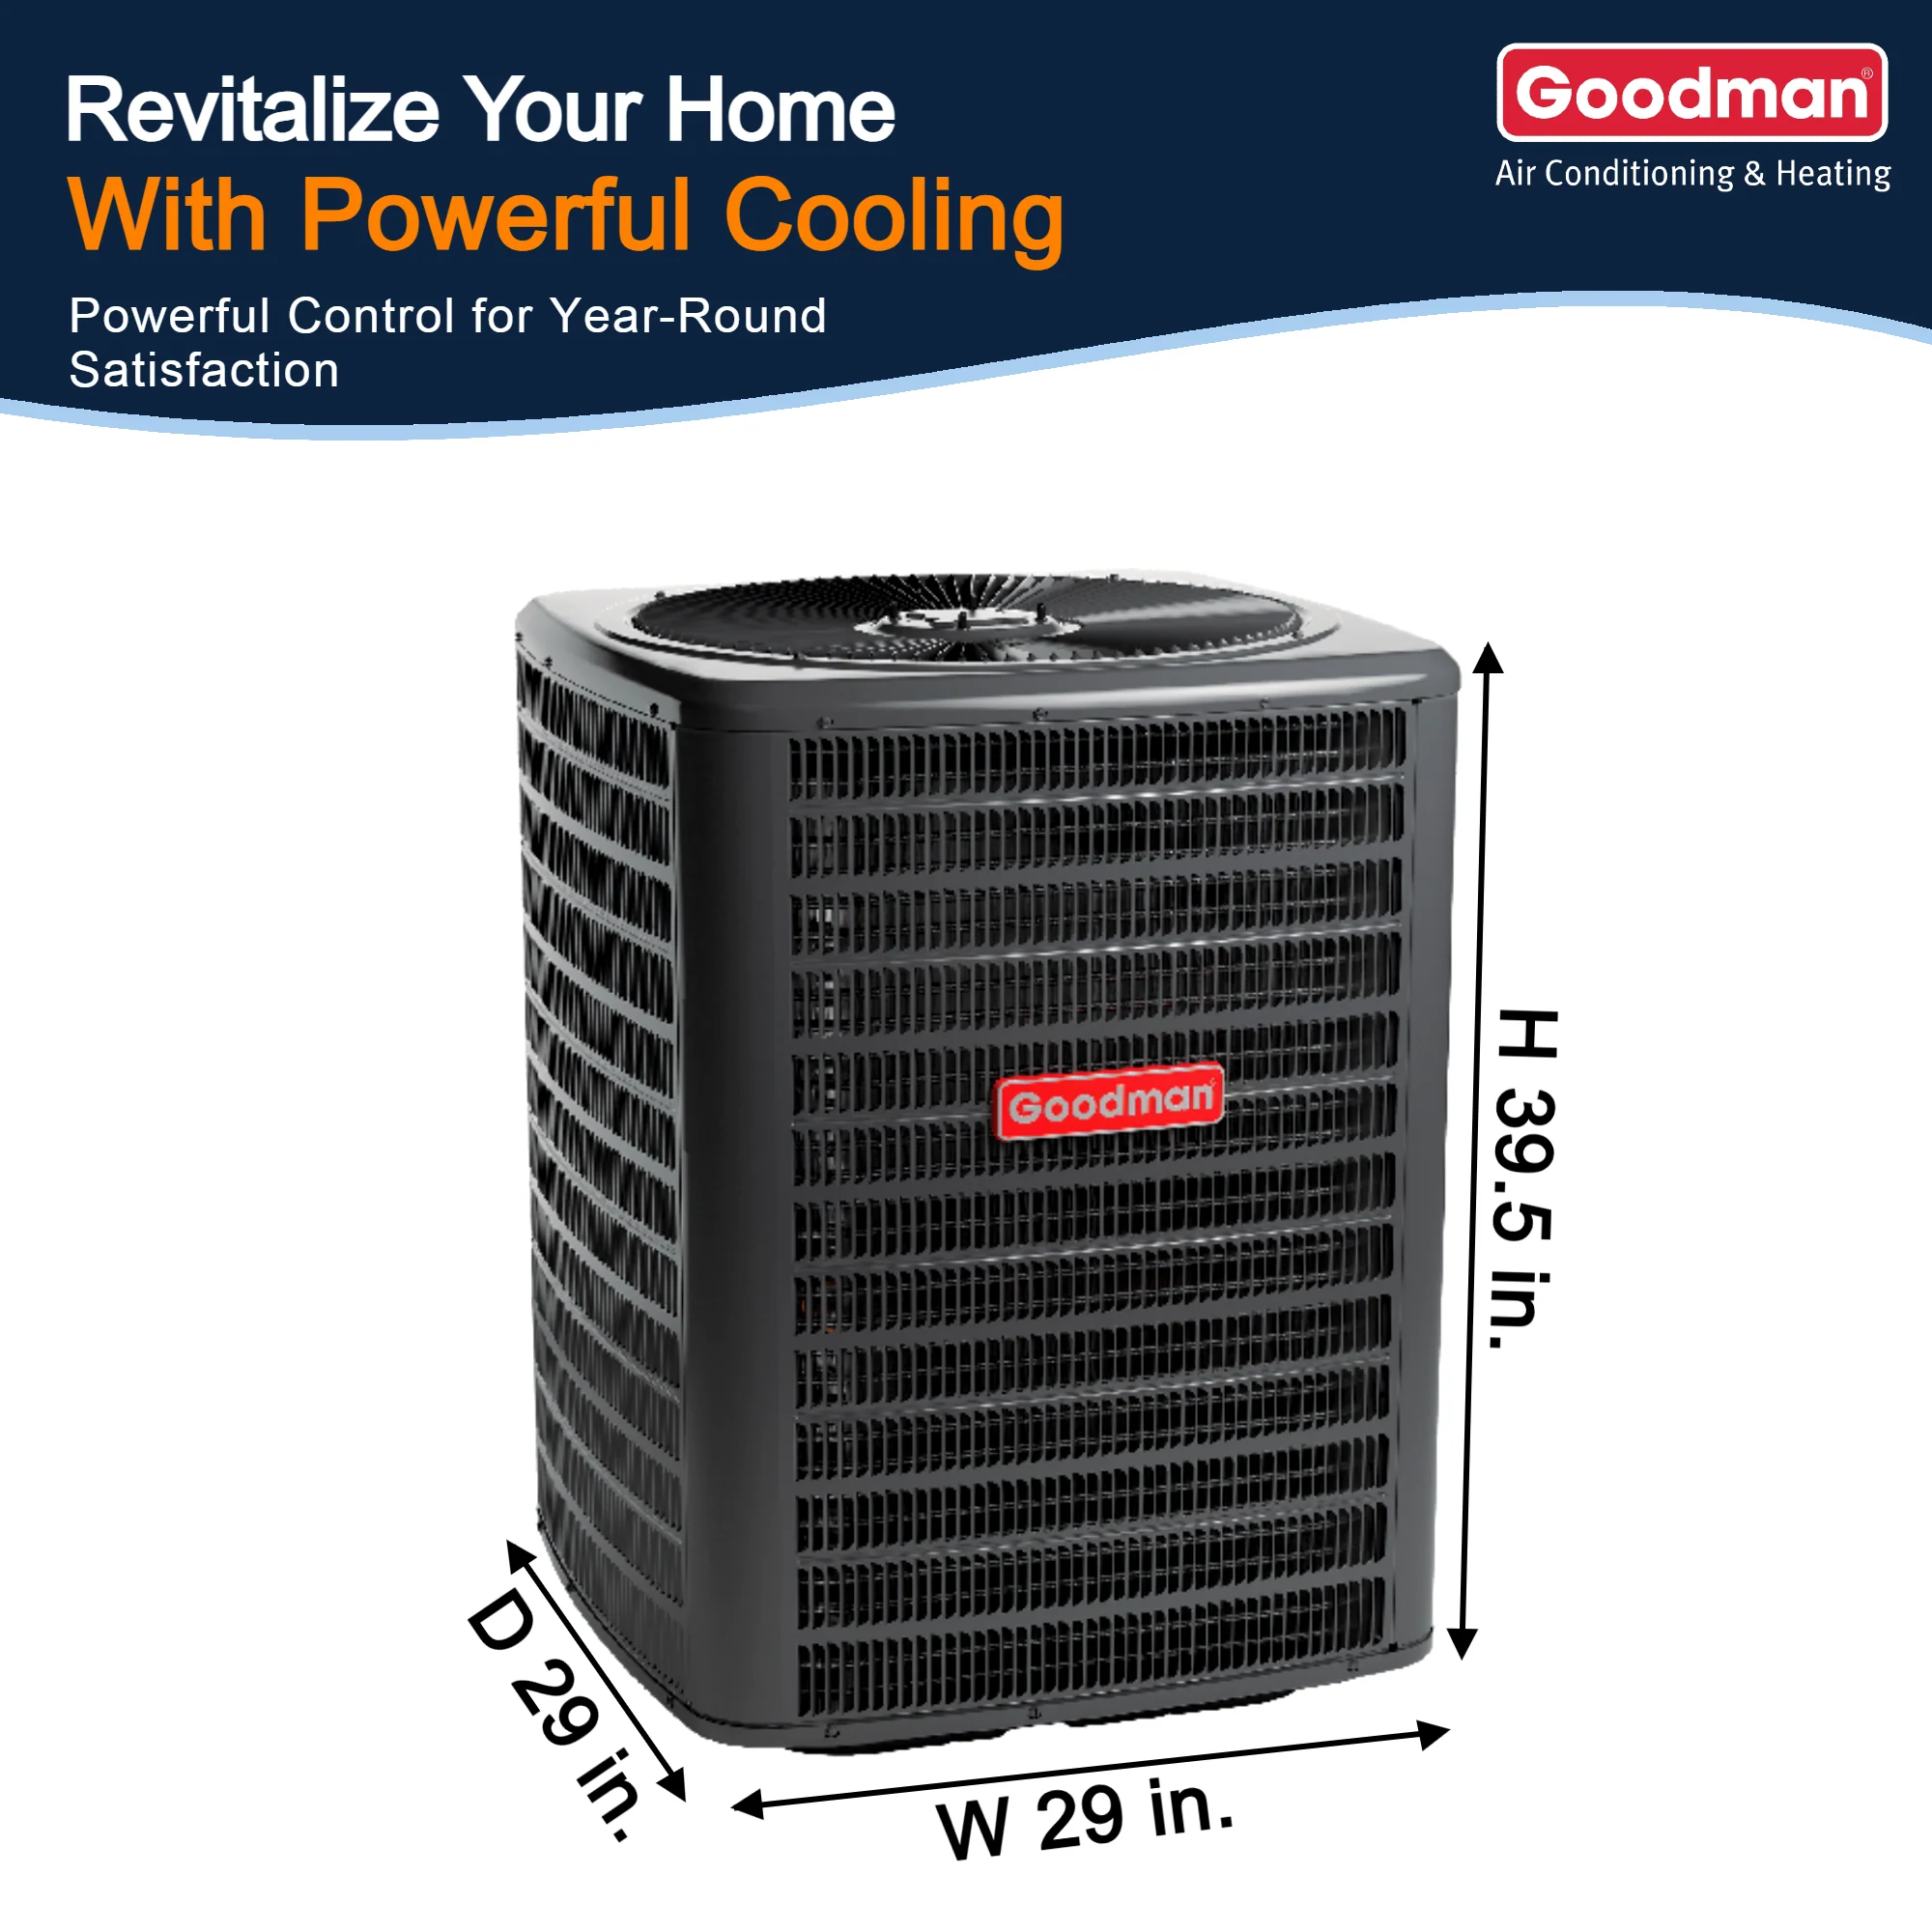
A 3-ton Goodman system should deliver:
1,050–1,200 CFM
3. Filter Differential Pressure
Clogged filters reveal themselves fast in the startup window.
A smart thermostat may flag reduced airflow, but tools confirm it.
4. Duct Leakage Awareness
If temperatures drift too slowly, duct leakage is often the culprit.
💧 5. Humidity Response — The “Hidden Efficiency” Metric
Icon: 🌫️
Humidity removal is a major aspect of cooling efficiency.
What You Want to See in 15 Minutes:
-
RH drops by 1–4%
-
Coil condensation stabilizing
-
Suction line sweating normally
-
No re-evaporation from fan cycling
If humidity is unchanged:
-
Airflow is too high
-
Coil is too warm
-
Charge may be off
-
Indoor fan runtime mode needs adjustment
Humidity stability in the first 15 minutes predicts comfort quality for the entire season.
🔊 6. Acoustic Diagnostics — Noise Tells the Truth
Icon: 🔈
Most mechanical problems announce themselves early through sound.
During the 15-minute test, listen for:
✔️ Normal Sounds:
-
Smooth fan whoosh
-
Mild compressor hum
-
Even airflow through vents
❌ Abnormal Sounds:
-
Buzzing
-
Clicking
-
Rattling
-
Pulsing
-
Whistling at vents
-
Clanging metal
Noise signatures often predict failing capacitors, loose mounts, improper refrigerant velocity, or duct design flaws.
🔥 7. Electrical Behavior — Amps, Voltages & Startup Current
Icon: 🔌
The First 15 Minutes Test includes monitoring:
-
LRA (Locked Rotor Amps)
-
RLA (Rated Load Amps)
-
FLA (Full Load Amps)
-
Voltage drop under load
What You Want:
-
Startup spike → quick drop
-
Running amps stable
-
Voltage consistent
Red Flags:
-
Spiking amps
-
Continuous rise in amps
-
Voltage sag >5%
These predict motor and compressor longevity.
🧊 8. Temperature Split Analysis — The Heart of the Test
Icon: 🌡️
A stable 15–22°F delta T during the first 15 minutes shows:
-
Good airflow
-
Correct refrigerant charge
-
Proper coil performance
-
Tight ductwork
-
Balanced return/supply
-
Healthy compressor
-
Good humidity control
A dropping or unstable split?
That’s the system waving a flag.
🧪 9. TXV/EEV Behavior — The Brain of the Refrigerant Circuit
Icon: 🧬
The TXV or EEV meters refrigerant precisely.
What Healthy Metering Looks Like:
-
Superheat stabilizes within 10–20°F
-
Subcool stabilizes within 8–14°F
-
Pressure fluctuations reduce over time
Red Flags:
-
Superheat swings
-
Chattering valve
-
No subcool
-
High head pressure
-
Low suction pressure
Metering problems often appear between minutes 5–12.
🧊 10. Condenser Exhaust Temperature — The Breath of the System
Icon: 💨
Use a thermometer at the condenser discharge.
Healthy exhaust:
110–150°F depending on ambient temperature.
Overheated exhaust:
Indicates recirculation issues — often due to poor clearance or sunlight exposure.
📉 11. Early Failure Prediction — What the First 15 Minutes Can Reveal
Icon: 🔍
This test can catch:
-
Low refrigerant charge
-
Overcharge
-
TXV issues
-
Coil clogging
-
Blower problems
-
Weak capacitors
-
Bad fan motors
-
Duct imbalance
-
High static pressure
-
Failing compressor
-
Incorrect airflow settings
-
Poor installation practices
-
System oversized or undersized
Think of it like an EKG for your HVAC system.
🏆 12. When the First 15 Minutes Look Perfect — What It Means for the Next 10 Years
Icon: ⭐
A system that passes all thresholds in the first 15 minutes will:
-
Run quieter
-
Use less energy
-
Reduce carbon emissions
-
Maintain coil health
-
Avoid compressor overheating
-
Maintain stable temperatures
-
Control humidity consistently
-
Require fewer repairs
-
Last much longer
This is the long-term benefit of proper startup.
🔧 13. How to Document the First 15 Minutes — Savvy’s Template
Icon: 📋
Record:
-
Ambient temperature
-
Return/supply temps
-
Suction/liquid pressures
-
Superheat/subcool
-
Delta T
-
Humidity
-
Amps
-
Static pressure
-
Exhaust temperature
-
Fan speed
-
Noise notes
This turns the test into a professional-grade diagnostic.
🌎 14. Sustainability Wins — Why the First 15 Minutes Are a Climate Tool
Icon: 🌱
A properly tuned startup:
-
Reduces watt draw
-
Prevents refrigerant leaks
-
Prevents over-exhaust conditions
-
Increases SEER2 performance
-
Protects compressors from early failure
-
Reduces landfill waste
-
Lowers carbon footprint
Sustainability starts with precision — and the First 15 Minutes Test is pure precision.
🔗 Final Verified Resources
-
EnergyStar HVAC Installation Guidelines
https://www.energystar.gov -
ACCA System Startup Procedures
https://www.acca.org -
ASHRAE Refrigerant & Compressor Behavior Standards
https://www.ashrae.org -
Building Science Corporation — Mechanical System Diagnostics
https://buildingscience.com -
EPA Indoor Air Quality & Moisture Standards
https://www.epa.gov/indoor-air-quality-iaq
🌟 Closing: A 15-Minute Ritual That Protects a Decade of Comfort
The First 15 Minutes Test isn’t just a diagnostic routine.
It’s the moment your HVAC system reveals who it will be for the next decade.
Will it be loud or quiet?
Efficient or wasteful?
Reliable or repair-prone?
Climate-smart or carbon-heavy?
Comfortable or inconsistent?
The answers appear in that tiny, powerful 15-minute window.
Interpret it correctly, and you unlock a lifetime of Savvy-approved performance.
Buy this on Amazon at: https://amzn.to/4hyDyKH
In the next topic we will know more about: Dual-Fuel Harmony — Installing AC + Gas Furnace Systems That Think (and Breathe) Like One Machine