By Samantha Reyes — Smart Shopper, Data-Driven Homeowner, and a firm believer that your comfort shouldn’t depend on guesswork.
Here’s something I learned after years of obsessing over airflow, duct design, and system sizing:
Your HVAC system isn’t guessing.
But your installer might be.
Most comfort issues — hot rooms, cold rooms, airflow conflicts, pressure imbalances, stuffy bedrooms, noisy returns — are diagnosed by “feel,” not by data.
But a simple $20 smart home sensor (temperature + humidity + sometimes pressure) from Amazon changes that completely.
It gives you real readings, room by room, minute by minute.
And once you can see your airflow problems, you can finally fix your airflow problems.
This article is your full guide to using a cheap sensor to uncover the weak points in your home’s comfort system — using the same data methods I use in my own house.
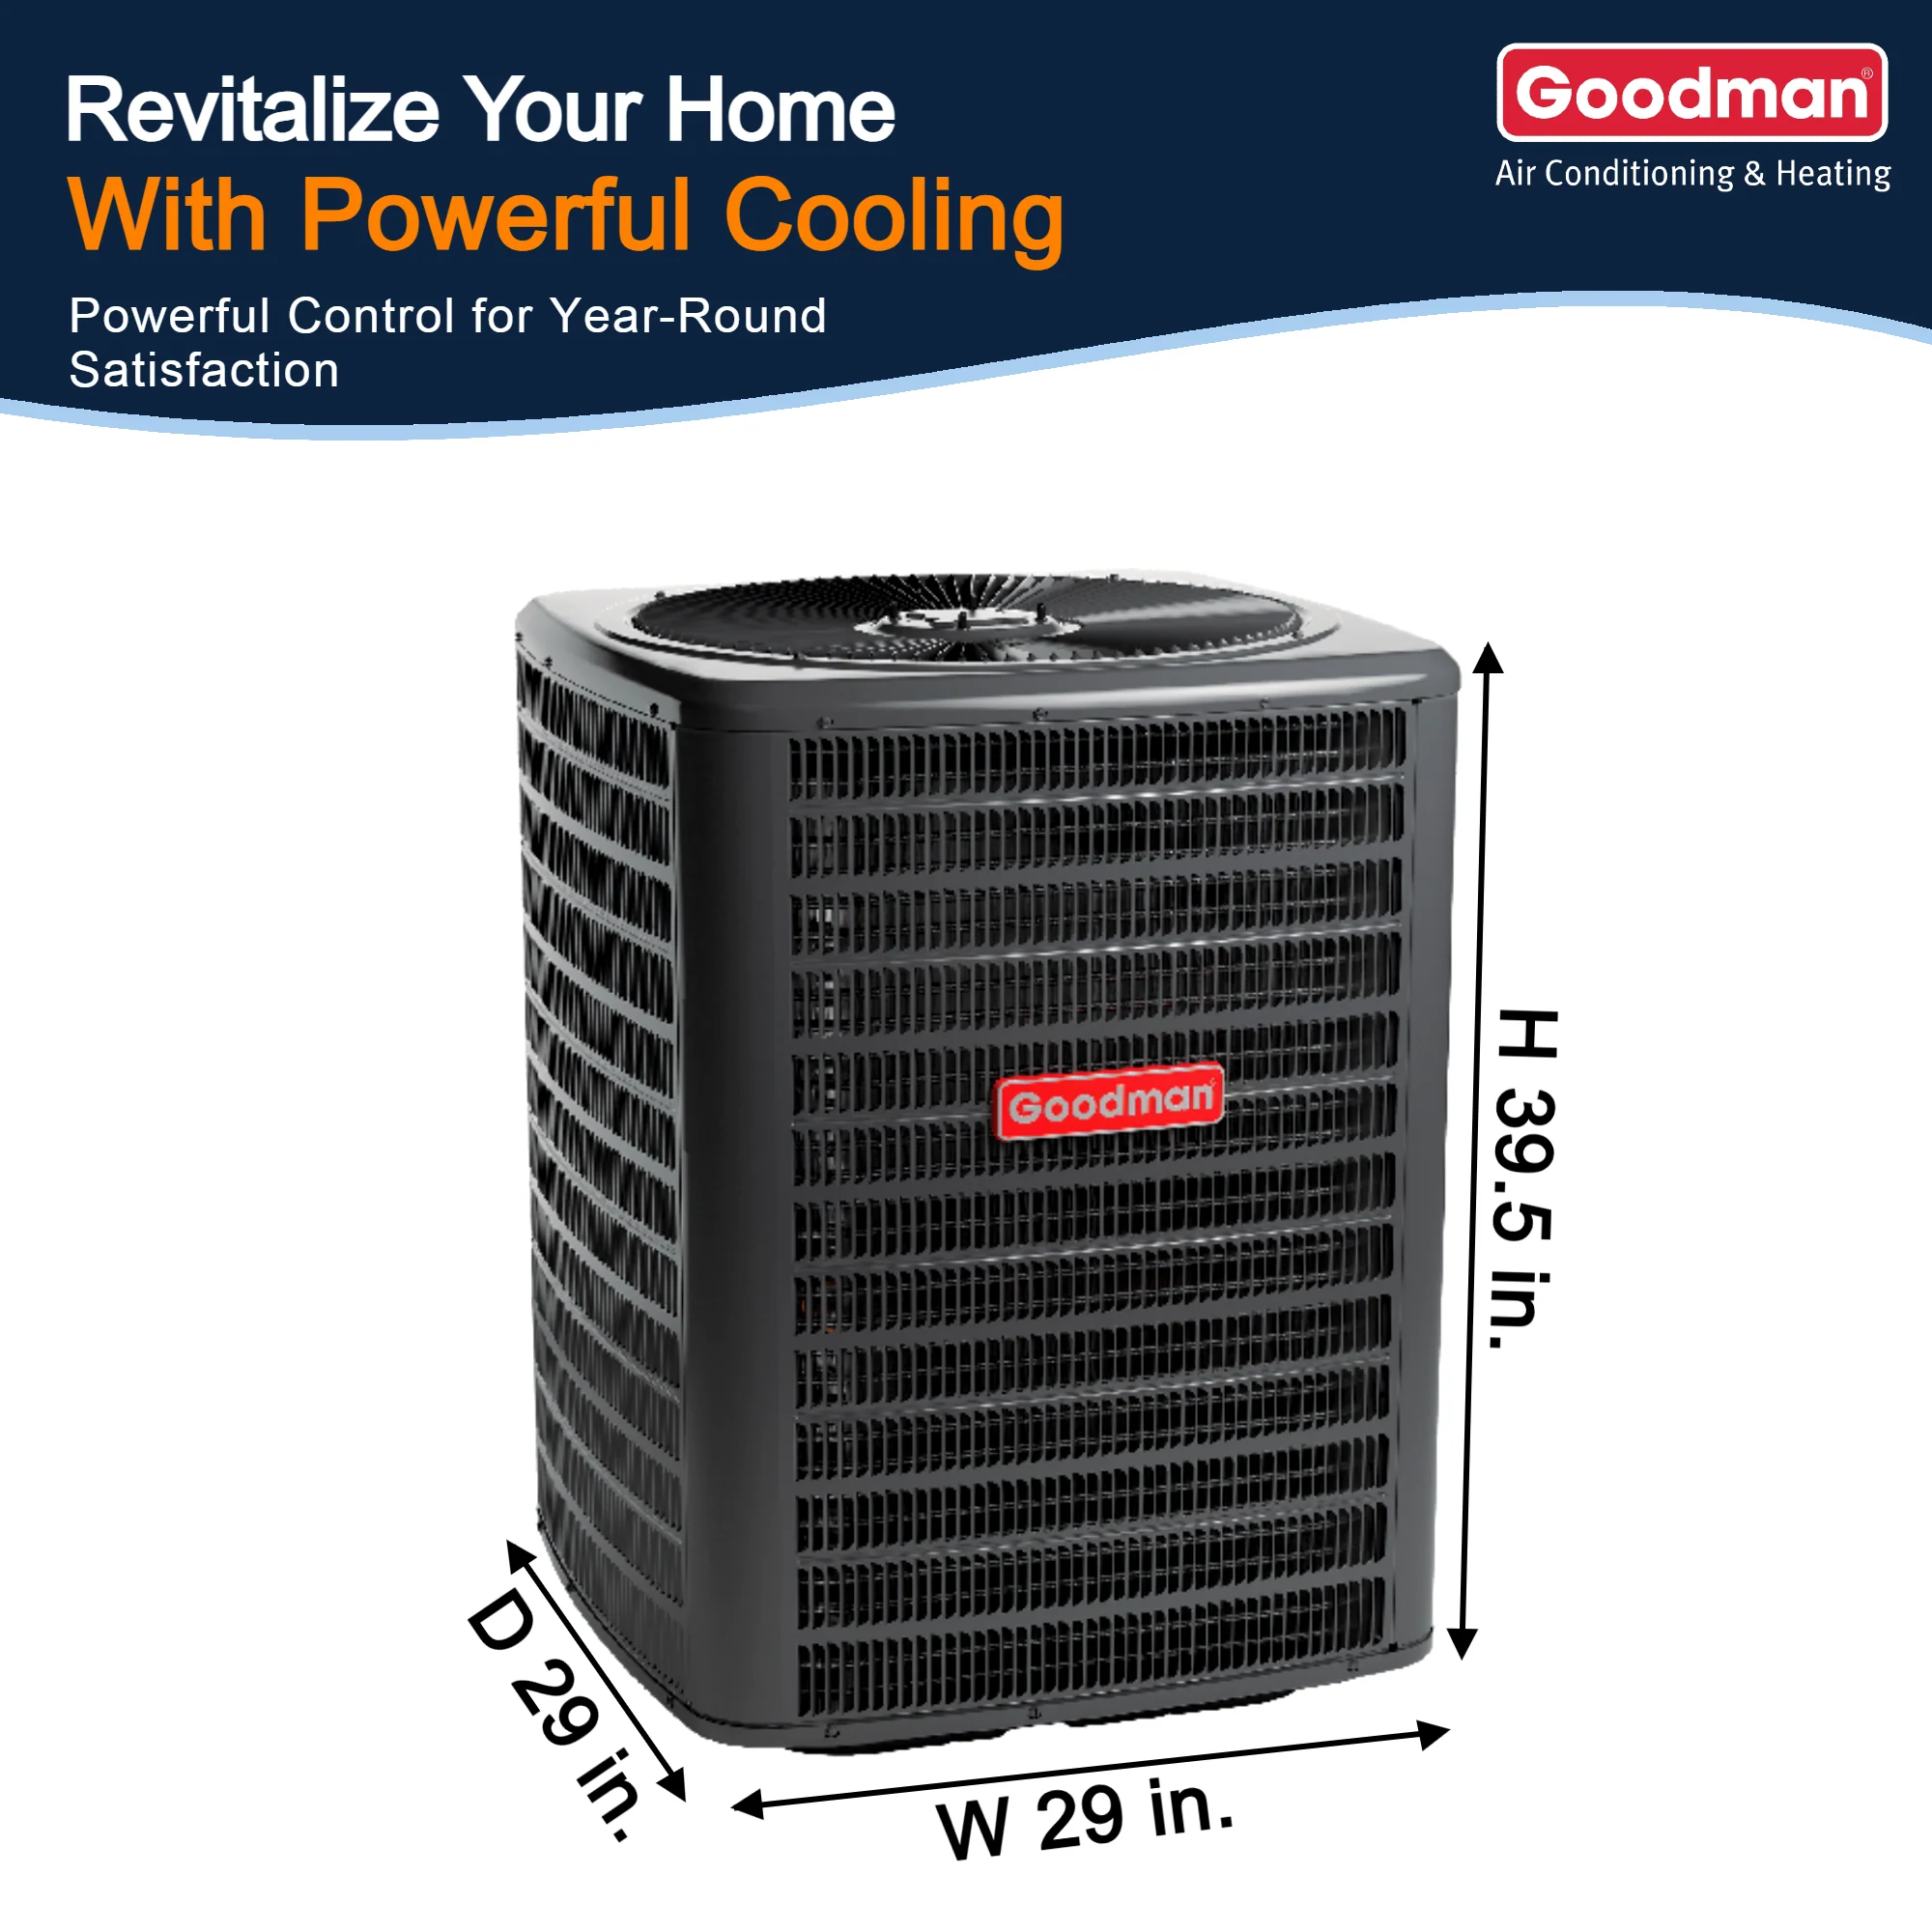
Goodman 3.5 Ton 15.2 SEER2 System
Square footage doesn’t diagnose comfort.
Tonnage doesn’t diagnose comfort.
Even your duct size doesn’t diagnose comfort.
But data does.
Let’s get started.
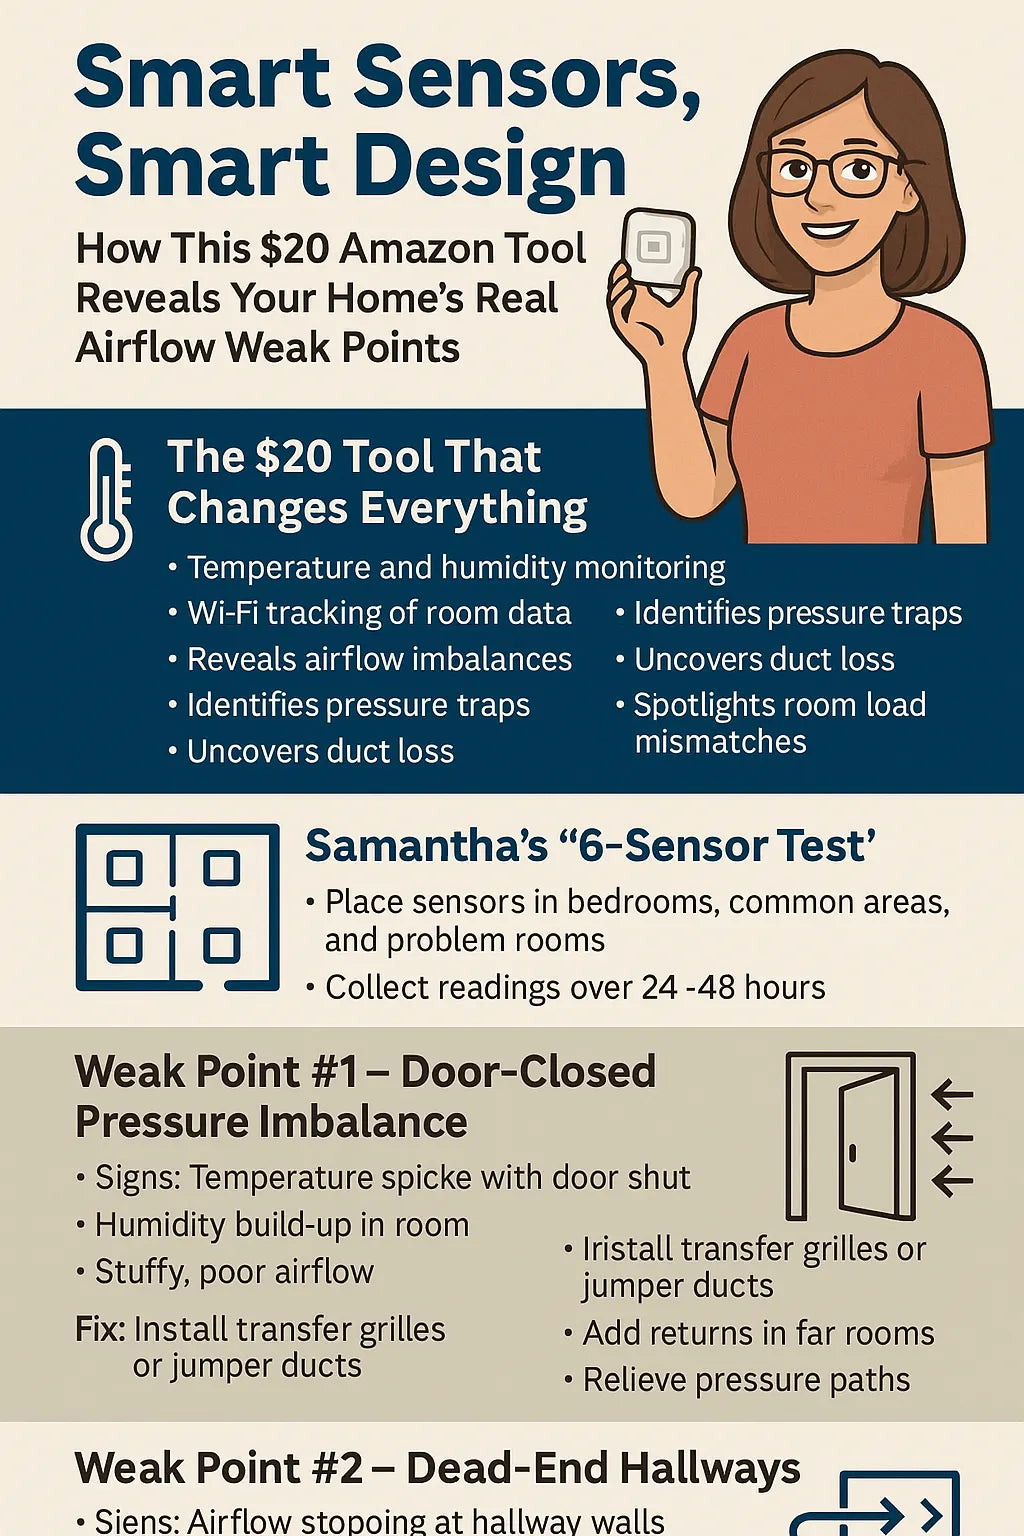
📱 1. The $20 Tool That Changes Everything
(Why Samantha Swears By It)
There are tons of simple, low-cost smart sensors on Amazon that measure:
-
temperature
-
humidity
-
dew point
-
(sometimes) barometric pressure
-
(sometimes) CO₂ or volatile organic compounds
-
Wi-Fi memory tracking
-
room-to-room deltas
You place them around your home, and suddenly… the invisible becomes visible.
ENERGY STAR recommends temperature and humidity monitoring as part of diagnosing HVAC performance
For around $20, these devices can reveal:
-
airflow imbalance
-
temperature stratification
-
humidity pockets
-
pressure traps
-
duct loss
-
supply starvation
-
return bottlenecks
-
room load mismatches
-
furnace or AC short cycling
-
poor coil performance
-
poor filtration flow
This is airflow detective work — made simple enough for any homeowner.
📊 2. The Core Principle: Comfort = Data + Design
🧠 Icon: Brain + airflow arrows
Instead of relying on:
-
your thermostat’s limited readings,
-
your installer’s “it seems fine,”
-
your own perception (which changes by the hour),
…a smart sensor gives you real-time load behavior for each room.
ASHRAE confirms that temperature and humidity distribution is the best indicator of airflow performance:
🔗 https://www.ashrae.org/technical-resources
Comfort = consistent temperature + stable humidity + balanced airflow
Sensors reveal the truth:
-
Which rooms heat faster?
-
Which rooms lose cool air faster?
-
Where is airflow blocked?
-
Which doors cause pressure imbalances?
-
Which rooms hold humidity?
-
Where airflow is too weak? Too strong?
Data turns comfort into a solvable engineering problem — not a guessing game.
🧪 3. Samantha’s “6-Sensor Test”: The Method That Maps Your Entire Home’s Airflow
📍 Icon: Grid of sensors
This is my personal system — the one I use to diagnose homes before recommending system changes.
You’ll need:
✔ six $20 smart sensors
✔ your phone
✔ 24–48 hours of normal living conditions
Place sensors in:
-
Primary Bedroom
-
Secondary Bedroom
-
Living Room (Open Area)
-
Kitchen
-
Basement / Lowest Level
-
Bonus Room or Problem Room
Then collect readings while:
-
doors open
-
doors closed
-
system running cooling
-
system running heating
-
system idle
The patterns you find will expose every airflow flaw.
Let’s walk through the biggest ones.
🚪 4. Weak Point #1 — Door-Closed Pressure Imbalance
Icon: Door swinging, airflow arrows
This is the airflow killer almost every home has.
When you close a bedroom door, your airflow system changes instantly.
The sensor will show:
-
temperature rising
-
humidity rising
-
airflow stopping
-
pressure building
-
comfort collapsing
ENERGY STAR identifies door-closed pressure imbalance as a major cause of comfort issues:
🔗 https://www.energystar.gov/products/air_cleaners
What causes it:
-
no return in the room
-
no transfer path
-
insufficient undercut
-
long duct runs
-
pressure trapped behind doors
What sensors reveal:
-
3–5°F swings within minutes
-
nighttime humidity spikes
-
temperature oscillation
-
blower noise increasing when doors close
Fix:
-
add transfer grilles
-
add a jump duct
-
increase door undercut
-
add a dedicated return in long hallways
🧱 5. Weak Point #2 — Dead-End Hallways
Icon: Hallway with airflow stuck
Hallways without returns choke airflow.
Your sensors in hallway-adjacent rooms will show:
-
slow temperature changes
-
trapped heat or cool air
-
weak supply airflow
-
humidity buildup
Why?
Air enters bedrooms but cannot escape back to the system.
Fixes:
-
add a hallway return
-
add a bedroom return
-
add pressure relief paths
-
widen airflow via jump ducts
ACCA Manual D warns about long hallways causing airflow stagnation:
🔗 https://www.acca.org
🌞 6. Weak Point #3 — Solar Load Zones (West and South Rooms)
Icon: Sun hitting a window
A $20 sensor will expose solar load like nothing else.
You’ll see:
-
temperatures rise sharply in the afternoon
-
humidity climb
-
room never catching up
-
AC running longer to cool these rooms
DOE confirms that solar gain is a dominant factor in cooling load:
🔗 https://www.energy.gov/energysaver/energy-saver
Fix:
-
add more supply CFM
-
upgrade register throw
-
adjust blower profile
-
add exterior shading or film
-
move the return position
-
use a larger coil for better latent removal
🪜 7. Weak Point #4 — Stairwell Heat Chimneys
Icon: Air rising up staircase
Your sensor at the top of the stairs will show:
-
rising temperature
-
stagnant airflow
-
humidity imbalance
Why?
Stairwells operate like natural convection shafts.
Fixes:
-
high-wall returns at the top level
-
low-wall returns at the lower level
-
zoning or sensor-based modulation
-
bypassing air through upper vents
ASHRAE studies show stairwells create vertical stratification in multi-level homes:
🔗 https://www.ashrae.org/technical-resources
🏚️ 8. Weak Point #5 — Bonus Rooms & Rooms Above Garages
Icon: Slanted roof + garage outline
These rooms almost always fail the sensor test.
Your data will show:
-
5–10°F deltas
-
extreme afternoon overheating
-
rapid heat loss at night
-
humidity spikes due to poor insulation
Why?
Heat enters from roof, walls, AND garage slab.
Fixes:
-
add supply vent
-
add return
-
increase duct size
-
boost airflow
-
seal knee walls
-
adjust blower programming
🌬️ 9. Weak Point #6 — Open-Concept Living Rooms (Airflow Dilution)
Icon: Wide room with airflow arrows spreading outward
Sensors in open spaces reveal:
-
slow temperature recovery
-
huge humidity swings
-
airflow that barely reaches the far walls
-
long AC runtimes
Why?
Air disperses instead of targeting heat loads.
Fixes:
-
add long-throw diffusers
-
increase CFM
-
move returns into the open space
-
create directional airflow paths
📉 10. Weak Point #7 — Poorly Sized Returns (Static Pressure Spikes)
Icon: Return grille with bottleneck arrows
This is one of the biggest problems the $20 sensor exposes indirectly.
Your signs will be:
-
warm bedrooms
-
cold hallway returns
-
high humidity
-
fast cycling
-
wide temperature deltas between sensors
If the sensor in hallway reads cool but bedroom sensors read warm → your return is too small.
Fixes:
-
larger return grille
-
bigger duct
-
deeper filter cabinet
-
add additional returns
📊 11. The “24-Hour Sensor Graph” — The Secret to Revealing Hidden Problems
Icon: Chart / graph
Every sensor app gives you a temperature and humidity graph.
Here’s what to look for:
1. Sawtooth Pattern
Up-down-up-down = short cycling.
2. Long Temperature Rise in One Room
That room has poor supply flow or excessive heat load.
3. Stable Humidity in Some Rooms, Rising in Others
Humidity pockets — usually due to airflow stagnation.
4. Fast Drops in Temperature
Indicates oversized equipment.
5. Sensor Patterns That Don’t Match the Thermostat
Your thermostat’s location is lying to you.
6. Pressure Events When Doors Close
Look for temperature OR humidity suddenly rising in a closed room.
🧠 12. Samantha’s 5-Point Sensor-to-Solution Method
Icon: Checkmark
This is the final step.
Data → Diagnosis → Design
…that’s the workflow.
Step 1 — Identify the Pattern
Every room has a “temperature signature.”
Step 2 — Identify the Cause
Solar? Pressure? Duct? Return? Load?
Step 3 — Apply the Appropriate Fix
Use the corrections in this article.
Step 4 — Re-Test
Make sure the change helped.
Step 5 — Build the Final Airflow Map
Now you know exactly how to design your next system.
🎯 Final Thoughts — Data Never Lies. Your Home Does.
When you use smart sensors:
-
airflow becomes visible
-
heat flow becomes predictable
-
humidity reveals duct performance
-
pressure shows up instantly
-
every room tells its story
A $20 tool reveals what $12,000 HVAC systems hide.
Your comfort doesn’t depend on bigger equipment.
It depends on better information.
Buy this on Amazon at: https://amzn.to/43doyfq
In the next topic we will know more about: Designing for Seasons You Don’t See: Samantha’s Hidden-Load Audit for Attics, Basements & Bonus Rooms