What “lifetime emissions” actually mean
Scope matters. Lifetime CO₂ includes: (1) direct, on-site combustion; (2) upstream fuel emissions (e.g., methane leakage for gas); and (3) electricity-sourced emissions for electric equipment. We express results in annual tons of CO₂ and 15–20-year totals, since most residential systems live in that range.
Quick visual where emissions originate:
Gas furnace: Wellhead/gathering → Processing → Pipeline → Burner [CO₂ + CH₄ leakage]
Electric heat: Power plant mix → Transmission → Air Handler/Coils [CO₂ varies by grid]
Heat pump: Same as electric, but 3–4× heat per kWh (COP advantage)
When comparing options, calculate Annual CO₂ = kWh × grid factor (kg/MWh) ÷ 1000 or therms × 11.7 lb CO₂/therm ÷ 2204.6. Keep the math in your job notes; it’s repeatable and transparent.
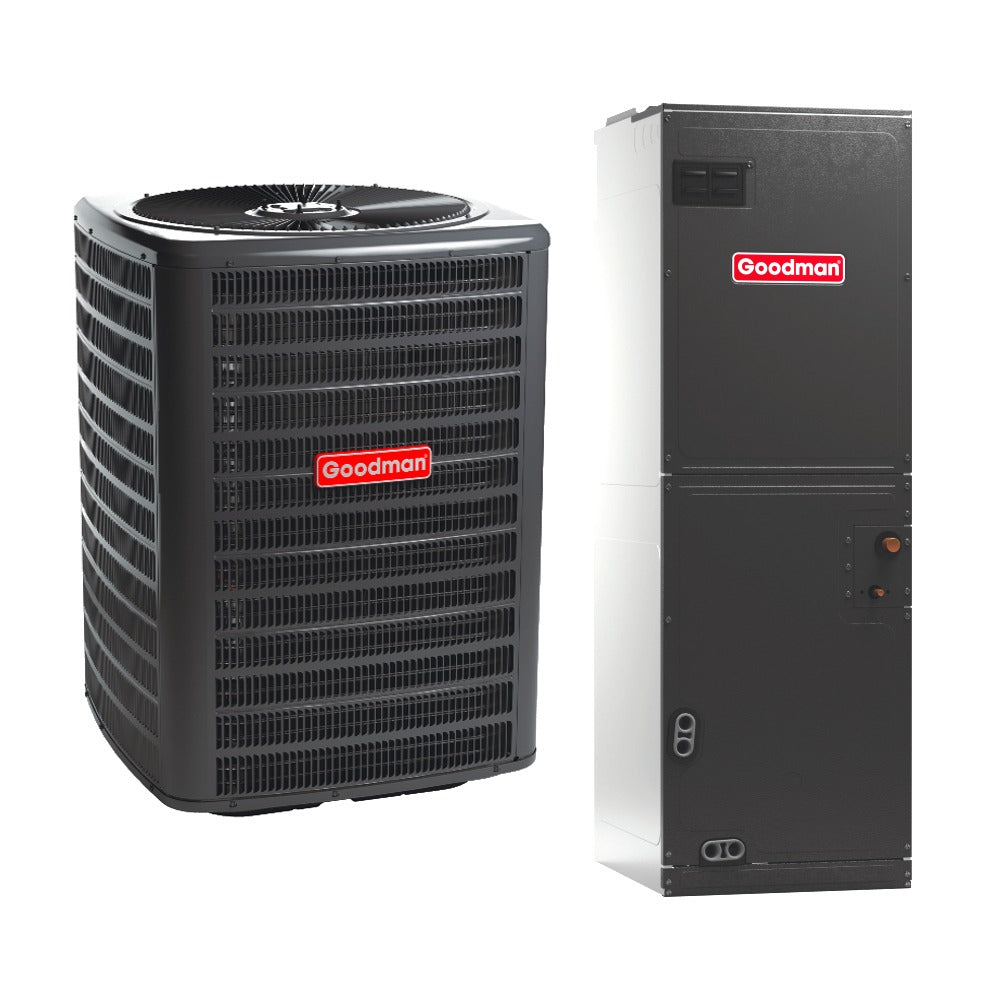
For product pairing, see Air Handlers.
Gas furnaces: steady output, steady emissions
A modern 95% AFUE gas furnace emits ~3.9 metric tons CO₂ per year, adding up to ~58.5–78 tons over 15–20 years. That footprint is relatively constant across regions because combustion happens on site. The catch: upstream methane leakage from extraction through local distribution adds warming that many calculators miss. Typical leakage estimates run ~1.2–4%, and a small number of “super-emitters” can dominate basin-level impacts.
Technical side note: Methane’s 20-year warming potential exceeds 80× CO₂, so leakage disproportionately loads the near-term climate balance.
Gas still has roles in specific applications (very low ambient cutovers, legacy ducting, or service constraints). If you must install gas, right-size the unit, seal ducts, and keep combustion tuned. Browse efficient Furnaces and verify airflow against the manufacturer’s temperature rise table during commissioning.
Electric resistance furnaces: entirely grid-dependent
Electric furnaces convert electricity to heat at ~100% efficiency but grid emissions drive the result. In coal-heavy regions, annual emissions can exceed ~5.2 tons CO₂ for a typical home load. In clean-grid states (high renewables/hydro), the same electric furnace can drop under ~0.5 tons/year. Because there’s no combustion on site, upstream methane isn’t a factor, but peak demand is: resistance heat creates the maximum electrical load per delivered BTU.
Resistance furnaces can spike service size requirements and winter bills. If you’re planning an electric, ask why it isn’t a heat pump. The installed cost delta is often recouped via lower operating cost and better carbon performance.
If the project must be all-electric today, consider packaged heat pump options first: Residential Packaged Systems.
Heat pumps: why they win on carbon (most grids)
Modern air-source heat pumps deliver 3–4 units of heat per unit of electricity (seasonal COP ~3–4 in mild weather). That efficiency cuts emissions to roughly ~1.2–2.8 tons/year across most U.S. grids even where electricity isn’t pristine—because you need fewer kWh to deliver the same heat. Cold-climate models hold COP ~2.4–3.8 down to ~-15°F, and ground-source systems maintain COP ~3.5–5.0 year-round.
A Pacific Northwest study found cold-climate heat pumps used ~24% less winter energy than gas furnaces, even during a -9°F cold snap.
For outdoor units with a lower-GWP refrigerant, browse R-32 Heat Pumps.
The grid factor: why the same system looks different by state
Electric emissions = kWh × grid carbon intensity. That intensity varies widely:
-
Clean-grid examples (≈<300 kg CO₂/MWh): Vermont ~110, Washington ~122, California ~195.
-
Coal-heavy to higher-carbon examples (often ~400–600+ kg CO₂/MWh): West Virginia ~404, Missouri ~567.
At a glance—annual CO₂ for the same seasonal load (illustrative):
|
System |
Clean grid (~150 kg/MWh) |
Higher-carbon grid (~550 kg/MWh) |
|
Electric resistance |
Low |
Very high |
|
Heat pump (COP 3) |
~⅓ of resistance |
~⅓ of resistance |
|
95% AFUE gas |
Constant (~3.9 t/yr) |
Constant (~3.9 t/yr) |
In clean and moderately clean states, heat pumps cut emissions ~58–93% vs. gas. Even on higher-carbon grids, heat pumps typically deliver ~15–36% reductions thanks to their COP advantage.
See regional-appropriate gear in Package Units.
Cold-climate performance & backup strategies
Heat pump efficiency declines with outdoor temperature, but design choices keep carbon and cost in check:
-
Cold-climate ASHPs handle a majority of annual load; set a balance point around 25–35°F (building-dependent).
-
Integrate dual fuel (gas furnace backup) or electric resistance strips for polar nights only.
-
Use weather-responsive controls to lock out resistance below targeted kW thresholds.
Model the seasonal bin hours and pick an outdoor design temp that captures ≥95% of hours on the heat pump. Calibrate charge and airflow (CFM/ton) after defrost checks; poor commissioning kills COP.
Need compact, zoned solutions? Consider PTAC Heat Pumps for multi-room retrofits without full ductwork.
Methane leakage: the hidden variable in gas footprints
Natural gas isn’t just the CO₂ from burning 11.7 lb/therm it’s also the methane that leaks from wells, gathering lines, processing plants, and city distribution. Measured supply-chain leakage typically spans ~1.2–4%, with “super-emitters” responsible for outsized shares in some basins. Because methane’s near-term warming is so potent, leakage can erase perceived advantages of “efficient” combustion on a 20-year horizon.
Design implication: If a client prioritizes near-term climate impact, it’s prudent to treat gas emissions as direct CO₂ + adjusted methane. That pushes many projects toward heat pumps or dual-fuel hybrids with minimized gas runtime.
When heat pumps are viable, see R-32 AC & Gas Furnace Combos for hybrid flexibility during extreme cold.
Future-proofing: grid decarbonization to 2050
Electricity is getting cleaner. Today (2024–2025), heat pumps reduce emissions in ~46/48 states. Under moderate scenarios by 2030, reductions vs. gas climb to ~50–75%; by 2035, ~70–85%; and by 2050, ~85–95% in deep-decarbonization trajectories. Critically, a heat pump installed now will likely emit less each year without changing the hardware as the grid adds renewables.
Owner guidance: If the client expects to keep the home >10 years, all-electric heat (preferably heat pumps) typically improves over its lifetime. Gas systems face potential headwinds: carbon pricing, methane rules, and local electrification codes.
Explore all-electric packages in R-32 Residential Packaged Systems.
Costs, sizing, and installed performance (where projects succeed or fail)
Installed costs vary: Gas $3k–$8k, Electric resistance $2k–$6k, Heat pumps $4k–$12k. Operating cost hinges on local $/therm and $/kWh and climate. As a rule, a properly selected heat pump’s COP offsets higher electric rates, especially in shoulder seasons.
Commissioning checklist: Room-by-room loads, duct leakage test, external static pressure, correct airflow, refrigerant charge under design conditions, and controls verification (defrost, lockouts, balance point).
Need quick scoping? Use our photo intake: Quote by Photo. For budgets, see HVAC Financing.
Decision playbooks by region & building type
Clean & moderately clean grids (renewables ≳20%): Lead with heat pumps. Expect ~58–93% lower CO₂ vs. gas. Use cold-climate models where winter lows demand it.
Coal-heavy or higher-carbon grids: Favor hybrid/dual-fuel: run heat pump above 25–35°F; lock in gas backup only during deep cold. This captures ~15–36% emissions savings today while positioning for future grid improvements.
Electrically constrained or zoned retrofits: Consider ductless mini-splits DIY options reduce install time; wall-mounted heads target problem rooms.
Do not spec electric resistance as primary heat unless backed by on-site renewables or unique constraints.
For full-package alternatives, see Residential Dual-Fuel Packaged Units.