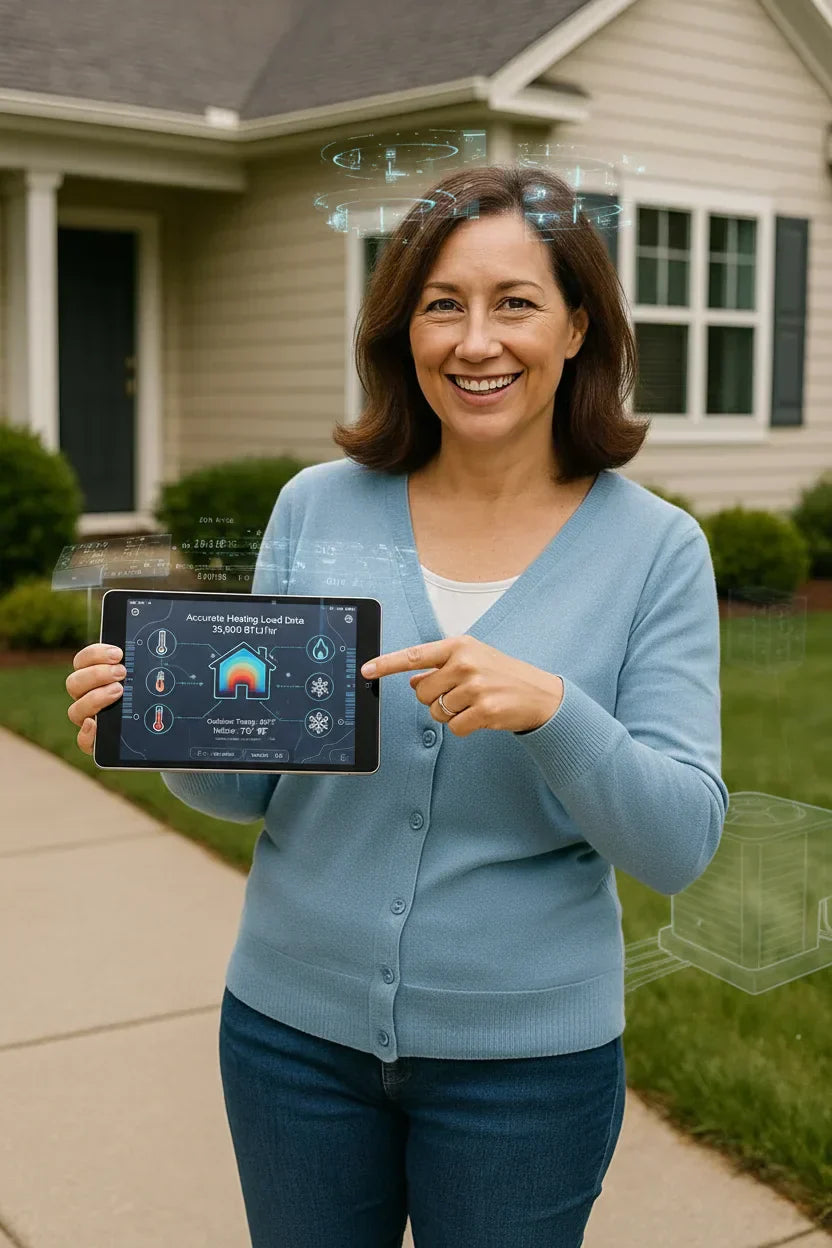
Most homeowners still rely on outdated “square footage × BTU multiplier” methods to size a heating system. But your home isn’t a spreadsheet — it’s a dynamic indoor climate with constant fluctuations in heat, airflow, humidity, infiltration, and thermal mass.
80,000 BTU 96% AFUE Upflow/Horizontal Two Stage Goodman Gas Furnace - GR9T960804CN
What your home actually needs isn’t a guess.
It’s a measurable number, and smart sensors finally make it possible to uncover it.
These small, affordable devices give you real-time data about:
-
How fast your home loses heat
-
How your rooms differ in temperature
-
Whether your furnace is oversized or undersized
-
How well your ductwork distributes heat
-
How humidity changes as your furnace cycles
-
Whether infiltration or insulation issues exist
-
The true BTUs needed to keep your home comfortable
This expanded guide walks you through Samantha’s advanced, field-tested sensor method — the same approach she uses to verify BTU requirements in real American homes.
🏠 1. The Problem: Heating Load on Paper Isn’t Heating Load in Real Life
Traditional furnace sizing uses:
-
Square footage
-
Climate zone
-
Insulation R-values
-
Window type
-
Manual J calculations
These methods are valuable, but they assume your home behaves like a “standard structure.”
But no home is standard.
Two identical homes can have wildly different heating loads because of:
-
Hidden air leaks
-
Duct leakage
-
Stack effect
-
Solar gain differences
-
How often doors open
-
How furniture obstructs airflow
-
Homeowner temperature habits
-
Basement moisture levels
-
Thermal mass in walls/floors
This is why Samantha insists:
“Heating load isn’t something you calculate once. It’s something you measure.”
Smart sensors are the first tool accessible to homeowners that can do exactly that.
📡 2. What Smart HVAC Sensors Actually Measure — And Why It Matters
Smart sensors monitor the environmental variables that determine real-world heating load.
Samantha uses sensors that track:
-
Temperature (°F)
-
Humidity (%)
-
Air quality (CO₂, VOCs)
-
Supply vent temperature
-
Return vent temperature
-
Motion/occupancy patterns
-
Long-term heating cycles
-
Outdoor temperature correlation
-
System run-time per hour
These numbers reveal the actual thermodynamics of your home — not the theoretical ones.
Verified External Resources
Here’s what these metrics mean in real-world building science:
-
U.S. DOE — Temperature & Heat Loss
https://www.energy.gov/energysaver -
Building Performance Institute — Infiltration Standards
https://www.bpihomeowner.org -
Efficient Windows Collaborative — Window Heat Transfer
https://www.efficientwindows.org -
EPA Indoor Air Quality
https://www.epa.gov/indoor-air-quality-iaq -
ACCA Manual D (duct performance)
https://www.acca.org/hvac/technical/manuals -
National Weather Service Climate Pages
https://www.weather.gov/wrh/climate
🔥 3. The Big One: Sensors Reveal Your Home’s True Heat Loss Rate
When your furnace shuts off, your home begins cooling.
That cooling speed is the purest indicator of heat loss.
Smart sensors track:
-
When the furnace stops
-
How fast the temperature drops
-
How far it drops before stabilizing
This “decay curve” is something engineers used to require specialized equipment for.
Now it’s available on your phone.
🌡️ 4. Samantha’s Home Heat Loss Graph (Typical Example)
If the home drops:
-
1°F per hour → tight envelope
-
2–3°F per hour → normal
-
4–6°F per hour → high heat loss
-
7°F+ per hour → severe leakage or undersized system
This is far more accurate than square footage.
🧊 5. Sensors Expose Cold Spots — The Invisible Enemies of Heating Load
Every home has them:
-
A chilly bedroom
-
A cold den near a sliding glass door
-
A basement corner with poor airflow
Sensors show exactly:
-
How much colder these rooms are
-
How long they take to warm
-
Whether duct flow is inadequate
-
If the furnace is short-cycling before these rooms heat
Example reading:
-
Living room: 70°F
-
Master bedroom: 70°F
-
Upstairs hallway: 69°F
-
Basement bedroom: 63°F
The basement bedroom is pulling the entire home’s heating load up.
This must be included in furnace sizing — traditional calculators would miss it.
🌬️ 6. Sensors Reveal Hot Spots Too — a Sign of Oversizing
Hot spots aren’t comfort — they’re a warning.
They mean:
-
The furnace heats too fast
-
Airflow is imbalanced
-
The furnace cycles off before heat distributes
-
The home’s thermal mass isn’t catching up
Example sensor curve:
-
Furnace on for 8 minutes → room jumps 4°F
-
Furnace off for 4 minutes → drops 3°F
-
Repeats endlessly
This is classic oversizing.
Sensor data makes it obvious.
🧪 7. Samantha’s 7-Day Smart Sensor Heating Audit (Expanded)
To reveal your heating load completely, Samantha recommends this 7-day test. Here’s the expanded version:
🗓️ Day 1 — Baseline Mapping
Place sensors in:
-
Main living area
-
Coldest room
-
Warmest room
-
Basement
-
Upstairs hallway
Let the home run normally. Observe:
-
Room differences
-
Sharp swings
-
Warm-up times
-
“Stagnant” rooms
🌙 Day 2 — Night Drift (The Core of BTU Sizing)
This is Samantha’s most important test.
-
Set thermostat to 65°F overnight
-
Leave it for 7–8 hours
-
Compare indoor low vs outdoor low
Formula:
Indoor Drop ÷ Outdoor Drop = Drift Coefficient
Lower coefficient = better insulation.
Higher = more heat loss.
♨️ Day 3 — Recovery Curve
See how long it takes the furnace to warm up after setback.
-
≤ 10 minutes → Oversized
-
10–20 minutes → Good
-
20–35 minutes → Likely undersized
-
35+ minutes → House is losing heat too fast
💨 Day 4 — Vent Temperature Spread
Record:
-
Supply temperature
-
Return temperature
Subtract to get ΔT (temperature rise)
-
Normal furnace: 35–65°F rise
-
Too high: airflow restriction
-
Too low: undersized furnace or duct leak
🌫️ Day 5 — Humidity Behavior
Sharp humidity drops mean infiltration.
Stable humidity = tight envelope.
📉 Day 6 — Long-Cycle Analysis
Review:
-
Furnace cycle length
-
Number of cycles per hour
-
Consistency during peak cold
Short cycles = too big
Long endless cycles = too small
📊 Day 7 — Calculate True Heating Load Using All Data
Combine everything:
-
Drift coefficient
-
Recovery time
-
Vent ΔT
-
Room differentials
-
Humidity trends
-
Cycle patterns
This gives you your true BTU requirement, not a guess.
🧮 8. Turning Sensor Data Into Furnace Size (Expanded Calculations)
Here is Samantha’s complete calculation method.
1. Determine Drift Rate
Example:
-
Indoor dropped 6°F
-
Outside dropped 20°F
Drift = 6 ÷ 20 = 0.30 per degree difference
2. Calculate design-day difference
Using official climate data:
National Weather Service Climate Pages
https://www.weather.gov/wrh/climate
Example:
-
Indoor target: 70°F
-
Local design-day low: 8°F
Difference = 62°F
62 × 0.30 = 18.6°F per heating cycle
3. Convert drift to BTUs
Building science rule:
1°F of loss per hour per 1,000 sq ft = ~1,200 BTUs/hr
Home size: 2,200 sq ft → multiplier = 2.2 × 1,200 = 2,640
18.6 × 2,640 = 49,104 BTUs/hr
This is your real heating load.
4. Convert heating load to furnace size
Furnace output = Furnace input × AFUE
Example:
49,104 ÷ 0.96 = 51,150 BTU furnace
A 60k two-stage furnace is ideal.
NOT an 80k.
NOT a 100k.
Sensors eliminate that guesswork.
🌀 9. Sensors and Furnace Staging — Why They Work Beautifully Together
Two-stage furnaces pair perfectly with sensor data because your home’s load isn’t fixed.
It changes by hour and by zone.
Smart sensors show:
-
When your home needs low stage (most days)
-
When it needs high stage (cold snaps)
-
Which rooms need more airflow
-
How to distribute heat evenly
This lets you size for average load—not worst-case load—without sacrificing comfort.
🧹 10. Sensors Expose Efficiency Problems You’d Never Notice
Smart sensors highlight:
-
Leakage around attic accesses
-
Bad door weatherstripping
-
Unexpected cold convection currents
-
Return duct leaks
-
Supply duct balancing issues
-
Rooms with closed-door heat traps
-
Large thermal mass differences
Each one alters your heating load.
Smart sensors tell you exactly where the problem is.
🎯 Conclusion: Smart Sensors Turn Your Home Into a Precision-Engineered Heating System
Sizing a furnace or heat pump based on floor area is old-fashioned.
Today, we can measure real-world heat loss minute by minute.
Smart sensors reveal:
-
True overnight drift
-
Room-by-room imbalances
-
Heating cycles
-
Infiltration-driven humidity dips
-
Real BTUs required to stay warm
And once you know your home’s real heating load, choosing the right furnace becomes effortless.
Buy this on Amazon at: https://amzn.to/4hJt23t
In the next topic we will know more about: Undersized vs. Oversized Furnaces: Samantha’s 8-Point Energy Waste Calculator You Should Try First

