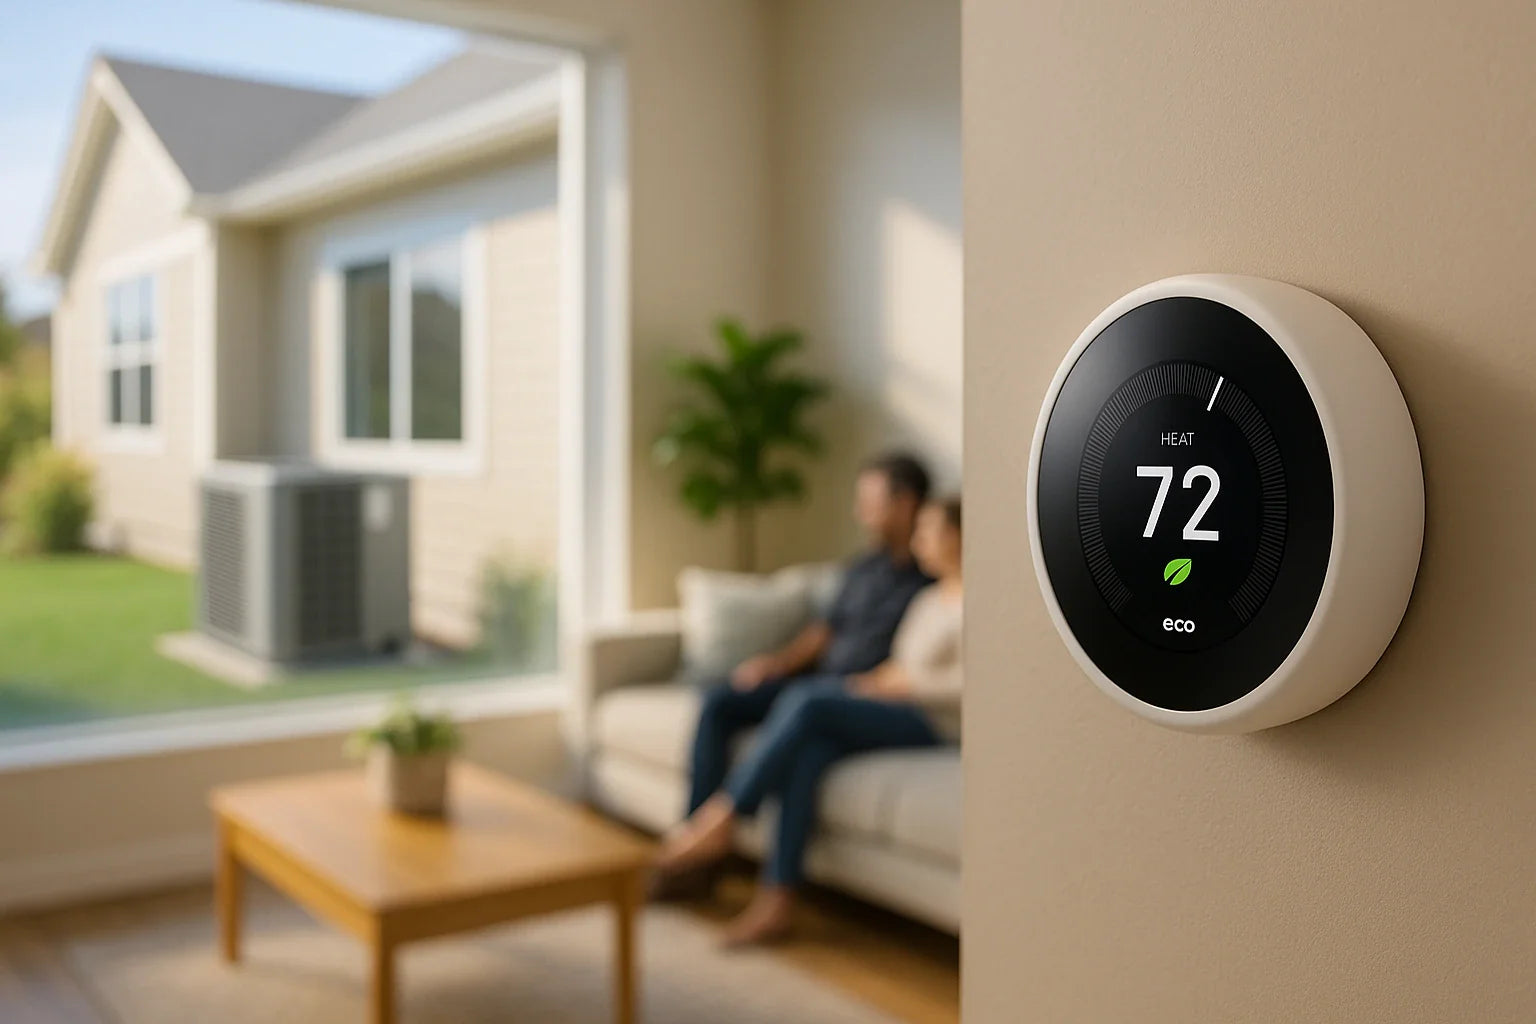
SEER2 in the Field: Why the Thermostat Is the Multiplier
SEER2 reflects performance under updated, more realistic test conditions. In homes, the variable that moves SEER2 from “spec sheet” to “savings” is control—runtime length, staging, supply airflow, humidity targets, and setback logic. Smart thermostats act as the orchestrator: they read indoor response versus outdoor load and modulate equipment to run longer at lower capacity, which reduces cycling penalties and improves latent removal. On variable-speed systems, this is the difference between frequent 100% bursts and smooth 35–60% operation.
Visual:
[Outdoor Load] → [Thermostat Logic] → [Compressor RPM / Fan CFM] → [Long, Low-Watt Runtime]
Each start carries inrush and suboptimal coil conditions; fewer starts typically mean better seasonal efficiency and comfort.
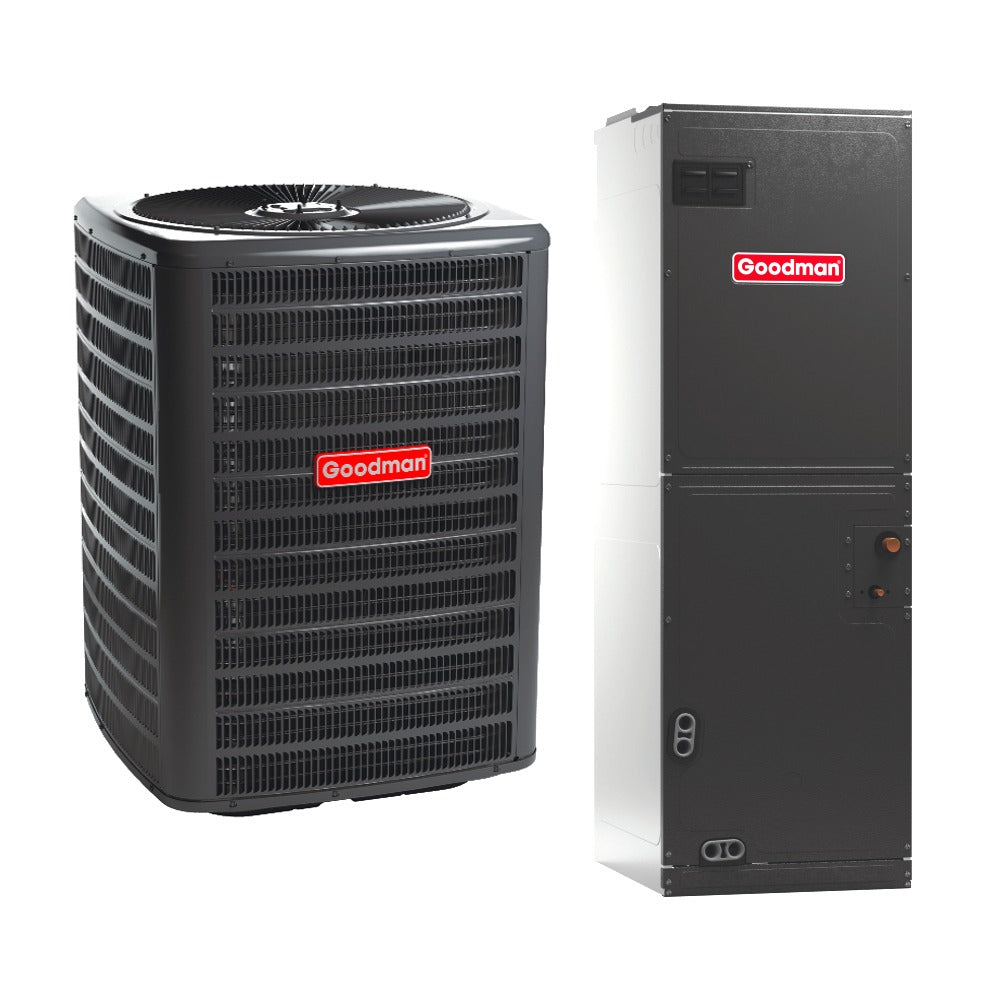
Field tip: Pair controls with the equipment class you’re installing—communicating stats for modulating condensers/heat pumps and compatible stats for two-stage furnaces or inverter air handlers. For system packages that simplify matching, see R32 packaged systems and package units.
Adaptive Learning & Schedule Optimization: From Habits to Setpoints
Learning thermostats watch manual overrides and occupancy patterns to build schedules that cut runtime when comfort isn’t needed. For SEER2 outcomes, the benefit is twofold: fewer peaks at full speed and tighter deadbands. After a week or two, most systems stabilize with: occupied cooling ~72–75°F, sleep 74–76°F, and away 76–80°F (adjust for climate and envelope).
Visual:
[Occupancy Pattern] + [User Overrides] → Auto-Schedule → Stable Deadband (±0.5–1.0°F)
Use “adaptive recovery” so pre-cooling starts at the lowest kW/ton part-load point, not full blast at the last minute.
Commissioning checklist: Confirm CPH (cycles/hour) or minimum on-time settings are conservative for inverter systems; keep minimum compressor speed enabled. Verify airflow tables in the air handler match the thermostat’s cooling stage calls. For homeowners upgrading equipment and controls together, browse R-32 AC + gas furnaces or complete AC + air handler systems.
Geofencing & Occupancy: Smarter Setbacks Without Comfort Penalties
Geofencing trims runtime when the house is empty and readies the space on approach. The goal isn’t extreme setbacks; it’s precise, load-aware adjustments that your equipment can recover from at low speed. Start with modest deltas (2–4°F cooling, 4–6°F heating). Layer in secondary signals—door/window sensors or motion—to avoid false absences.
Visual:
Phone Location → "Away" (Setback) → Lead Time ETA → Gradual Pre-Cool at 40–60% Capacity
On high humidity days, deep cooling setbacks can spike indoor RH during recovery. Use “max humidity” or dew-point targets (see next section) to cap RH during geofence transitions.
Field tip: In multi-family or hospitality installs, room-side geofencing isn’t practical; use PTAC/VTAC units with onboard occupancy logic. See hotel heat & air, PTAC heat pumps, and VTAC units.
Remote Control & Real-Time Overrides: Keep SEER2 Gains On Track
Remote access isn’t just convenience; it protects savings. If a heat wave hits while you’re out, nudging setpoints +2°F via app prevents a high-speed scramble later. For contractors, remote dashboards (when enabled by the homeowner) show runtime anomalies after a change-out, helping you catch airflow or charge issues before comfort calls.
Visual:
Weather Alert → Remote Setpoint Nudge → Avoid Full-Speed Recovery → Lower kWh
Educate users to make small, early adjustments. Large, late changes drive the system to maximum capacity, eroding part-load efficiency.
After installing new equipment, set up a 7–14 day “tuning window” with remote check-ins. Pair this with a filter reminder schedule and a quick link to accessories like high-MERV media, condensate pumps, and smart sensors. For non-ducted projects, consider DIY ductless mini-splits so homeowners can monitor zones individually.
Variable-Speed Integration: Staging, Airflow, and Compressor Logic
SEER2-optimized systems live at part load. To get there, the thermostat must coordinate compressor RPM, indoor fan CFM, and—on heat pumps—reversing valve timing and defrost strategy. Set conservative ramp profiles: start at low CFM per ton (e.g., 325–375 CFM/ton for humidity-heavy regions) and let the stat escalate slowly as delta-T shrinks.
Visual:
Stage 1: 35–45% → Stage 2: 55–70% → Peak: 85–100% (rare)
Ensure the stat speaks the same language—communicating controls for communicating equipment; proper Y1/Y2/W1/O/B mapping for conventional. Validate blower tables so low-speed cooling doesn’t underflow the coil.
On new installs, consider matched R32 condensers + coils or packaged heat pumps for tested pairings. For tight closets, wall-mount indoor units from our mini-split lineup can deliver precise staging per zone.
Humidity, Dew Point, and Comfort Metrics that Protect Efficiency
Comfort equals temperature and moisture. A smart thermostat that watches RH or dew point can hold a slightly higher dry-bulb while feeling just as cool. Target 45–55% RH in cooling season; use lower airflow at first stage to improve latent removal.
Visual:
Dew Point (°F) = Tdb − ((100 − RH)/5)
If the stat supports “cool to dehumidify,” cap coil temperature to limit over-cooling while protecting latent capacity. For systems with dedicated dehumidifiers, integrate run permission to avoid fighting the AC.
Persistent high indoor RH is a diagnostic clue—check for oversized equipment or excessive CFM/ton. Consider multi-zone ductless cassettes for rooms with intermittent loads. Where fresh air is added, verify that ventilation schedules don’t undo humidity targets.
Energy Reports & Insight: Turning Data into Measurable SEER2 Gains
The most useful dashboards trend runtime vs. outdoor temperature, stage distribution, and indoor RH. You’re looking for long, steady low-stage runtimes and predictable starts near load increases (late afternoon). Spiky graphs suggest control or mechanical issues.
Visual:
kWh vs. OAT → Flat slope at low OAT variance = good control
Use degree-hour normalization: divide daily runtime by cooling degree hours to track control improvements after changes. If the stat exports CSVs, spot-check with a 3–5 day rolling average.
After a thermostat upgrade, compare a week before vs. after at similar weather. If low-stage runtime share hasn’t increased, revisit airflow, setpoint deadbands, and geofencing thresholds. Need equipment to match what the data says? Explore through-the-wall units or heat pumps for room-by-room control.
Maintenance Alerts & System Health: Protecting Efficiency Over Time
SEER2 savings collapse when filters plug, coils foul, or condensate safeties trip. Smart thermostats that log fault codes, airflow estimates, or coil temperature trends flag problems early. Set filter reminders based on fan hours, not calendar days, and add alerts for abnormal CFM/ton or excessive long-cycle dehumidification.
Visual:
Alert → Inspect → Correct (Filter/Charge/Airflow) → Restore Low-Stage Runtime
Tie float switch trips and high-pressure/low-suction events to push notifications. If the stat supports supply/return sensors, set an alert when delta-T drifts outside 16–22°F (cooling) under steady load.
Keep common parts on hand—media filters, pads, UV bulbs. See accessories and line sets for retrofit jobs. For quick homeowner support, point to the Help Center.
Smart Home Integrations: Sensors, IAQ, and Whole-Home Logic
Integration isn’t just voice control. Door sensors pause cooling during long openings; leak detectors trigger system off; CO/IAQ sensors adjust ventilation or fan recirculation. For SEER2, the win is better context: the stat makes load decisions with more inputs, which keeps the system at low speed longer.
Visual:
[IAQ Sensor] + [Door Contact] + [Weather] → Unified Scenes → Stable Loads → Efficient Part-Load
Use dew-point-aware scenes (e.g., “High Humidity” lowers CFM/ton and expands deadband slightly). For zoned ductless, platform routines can coordinate multiple heads to avoid overlapping high stages.
In hospitality or commercial corridors, consider packaged solutions with proven controls.
Commissioning & Verification: A Pro’s Checklist for SEER2 Results
You can’t optimize what you didn’t verify. On day one, confirm: design CFM (350–450 CFM/ton typical; reduce toward 325 for humidity control), external static pressure within nameplate, charge by manufacturer method, accurate sensor placement, and thermostat equipment configuration. Enable adaptive recovery, set modest setbacks, verify humidity targets, and lock out excessive high-stage calls.
Visual:
Measure → Configure → Observe Data → Fine-Tune → Re-verify
Test geofence with a controlled “leave/arrive” and watch how the stat stages recovery. Trend 48 hours of runtime; target >60% of hours in low stage during typical weather.
For tight timelines, use our Quote by Photo, Design Center, and HVAC Financing. Considering packaged, dual-fuel, or mini-split alternatives?