Why a SEER2 Infographic Helps Real Homeowners Decide
Picture this: your summer bill jumps, your AC’s running longer, and you’re staring at a wall of model numbers. A well-built SEER2 infographic cuts through that noise. It turns test ratings, cost comparisons, and “what-if” savings into something you can understand in a minute no engineering degree required. You see where your current unit sits, what a step up looks like, and how much that change means in dollars, not buzzwords. For property managers or anyone buying multiple units, it’s even more valuable: one quick visual to compare tiers, estimate operating costs, and prioritize upgrades. Throughout this guide, I’ll show you how to read those visuals like a pro, how SEER2 works in the real world, and which decisions actually move the needle on comfort and cost. If you’re shopping, keep a tab open to The Furnace Outlet so you can cross-check models as we go.
What Is SEER2 and Why It Replaced SEER
SEER2 (Seasonal Energy Efficiency Ratio 2) became the new national efficiency test on January 1, 2023. It didn’t make ACs worse; it made the test stricter and more realistic. The big change is higher external static pressure 0.5" vs. 0.1" to better reflect how real duct systems push back on airflow. Because the test is tougher, a unit that was 16 SEER might look roughly 15.2 SEER2. Same equipment, just a truer score. Why should you care? Because SEER2 is a better predictor of your actual power use. When you see SEER2 on a spec sheet or infographic, you’re getting an efficiency number that maps more closely to your utility bill. If you’re comparing an older system labeled with SEER to a new one labeled SEER2, look for a conversion reference in the infographic or ask the seller for an equivalent estimate so you’re comparing apples to apples.
How to Read a SEER2 Infographic in 60 Seconds
A good infographic respects your time. Start at the rating scale: color-coded from minimum standard to premium. Next, hit the side-by-side comparison: 13.4, 14.3, 16, 18, 20, 22 SEER2 each with estimated annual energy cost and savings vs. baseline. Then scan the long-term value panel: 10- or 20-year savings add up fast when power rates rise. Look for simple, consistent visuals icons for efficiency, cost, and environmental impact; clean typography; and clear labels. A tight infographic also includes a conversion chart (for older SEER numbers), a quick decision tree (age, repair frequency, bills, comfort), and a savings calculator note (hours of use, local rates, climate). Keep an eye out for accessibility features plain language, logical flow, and uncluttered layouts. If you can’t understand it in under a minute, it’s not doing its job.
Regional Minimums: Do You Need 13.4 or 14.3 SEER2?
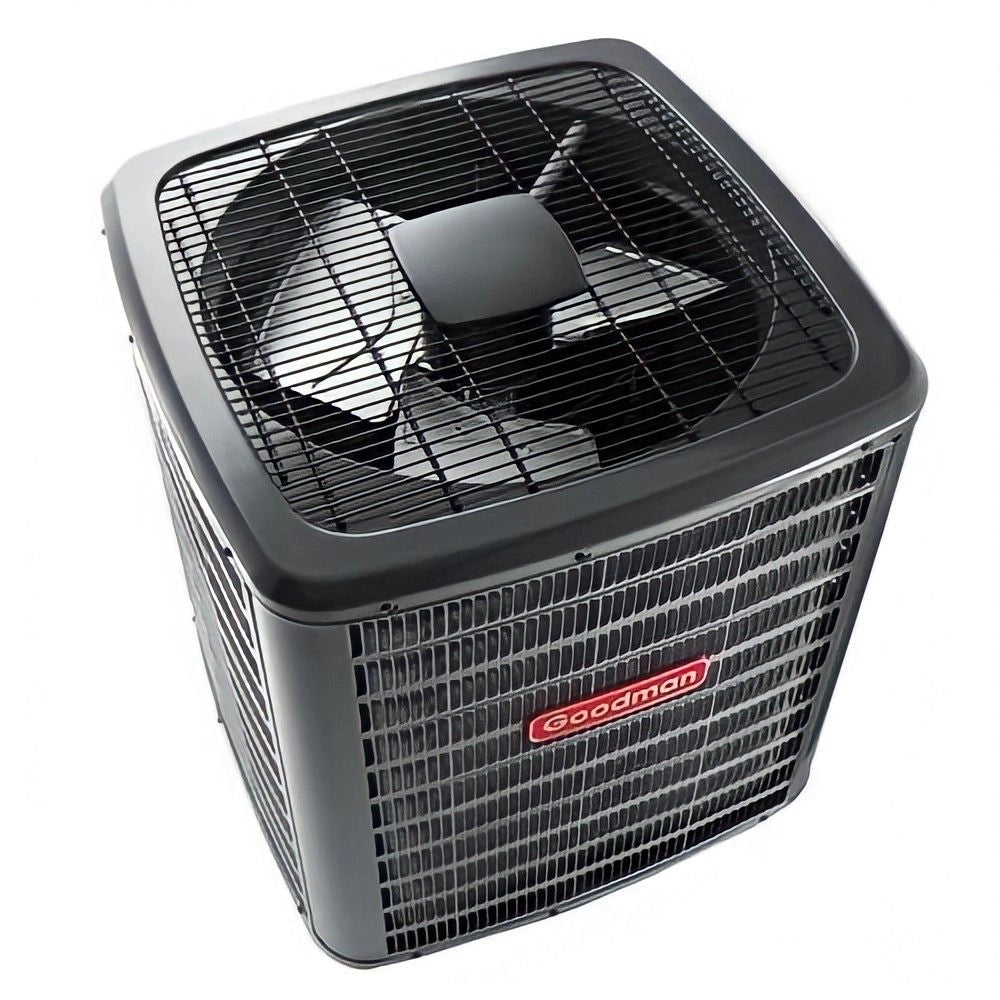
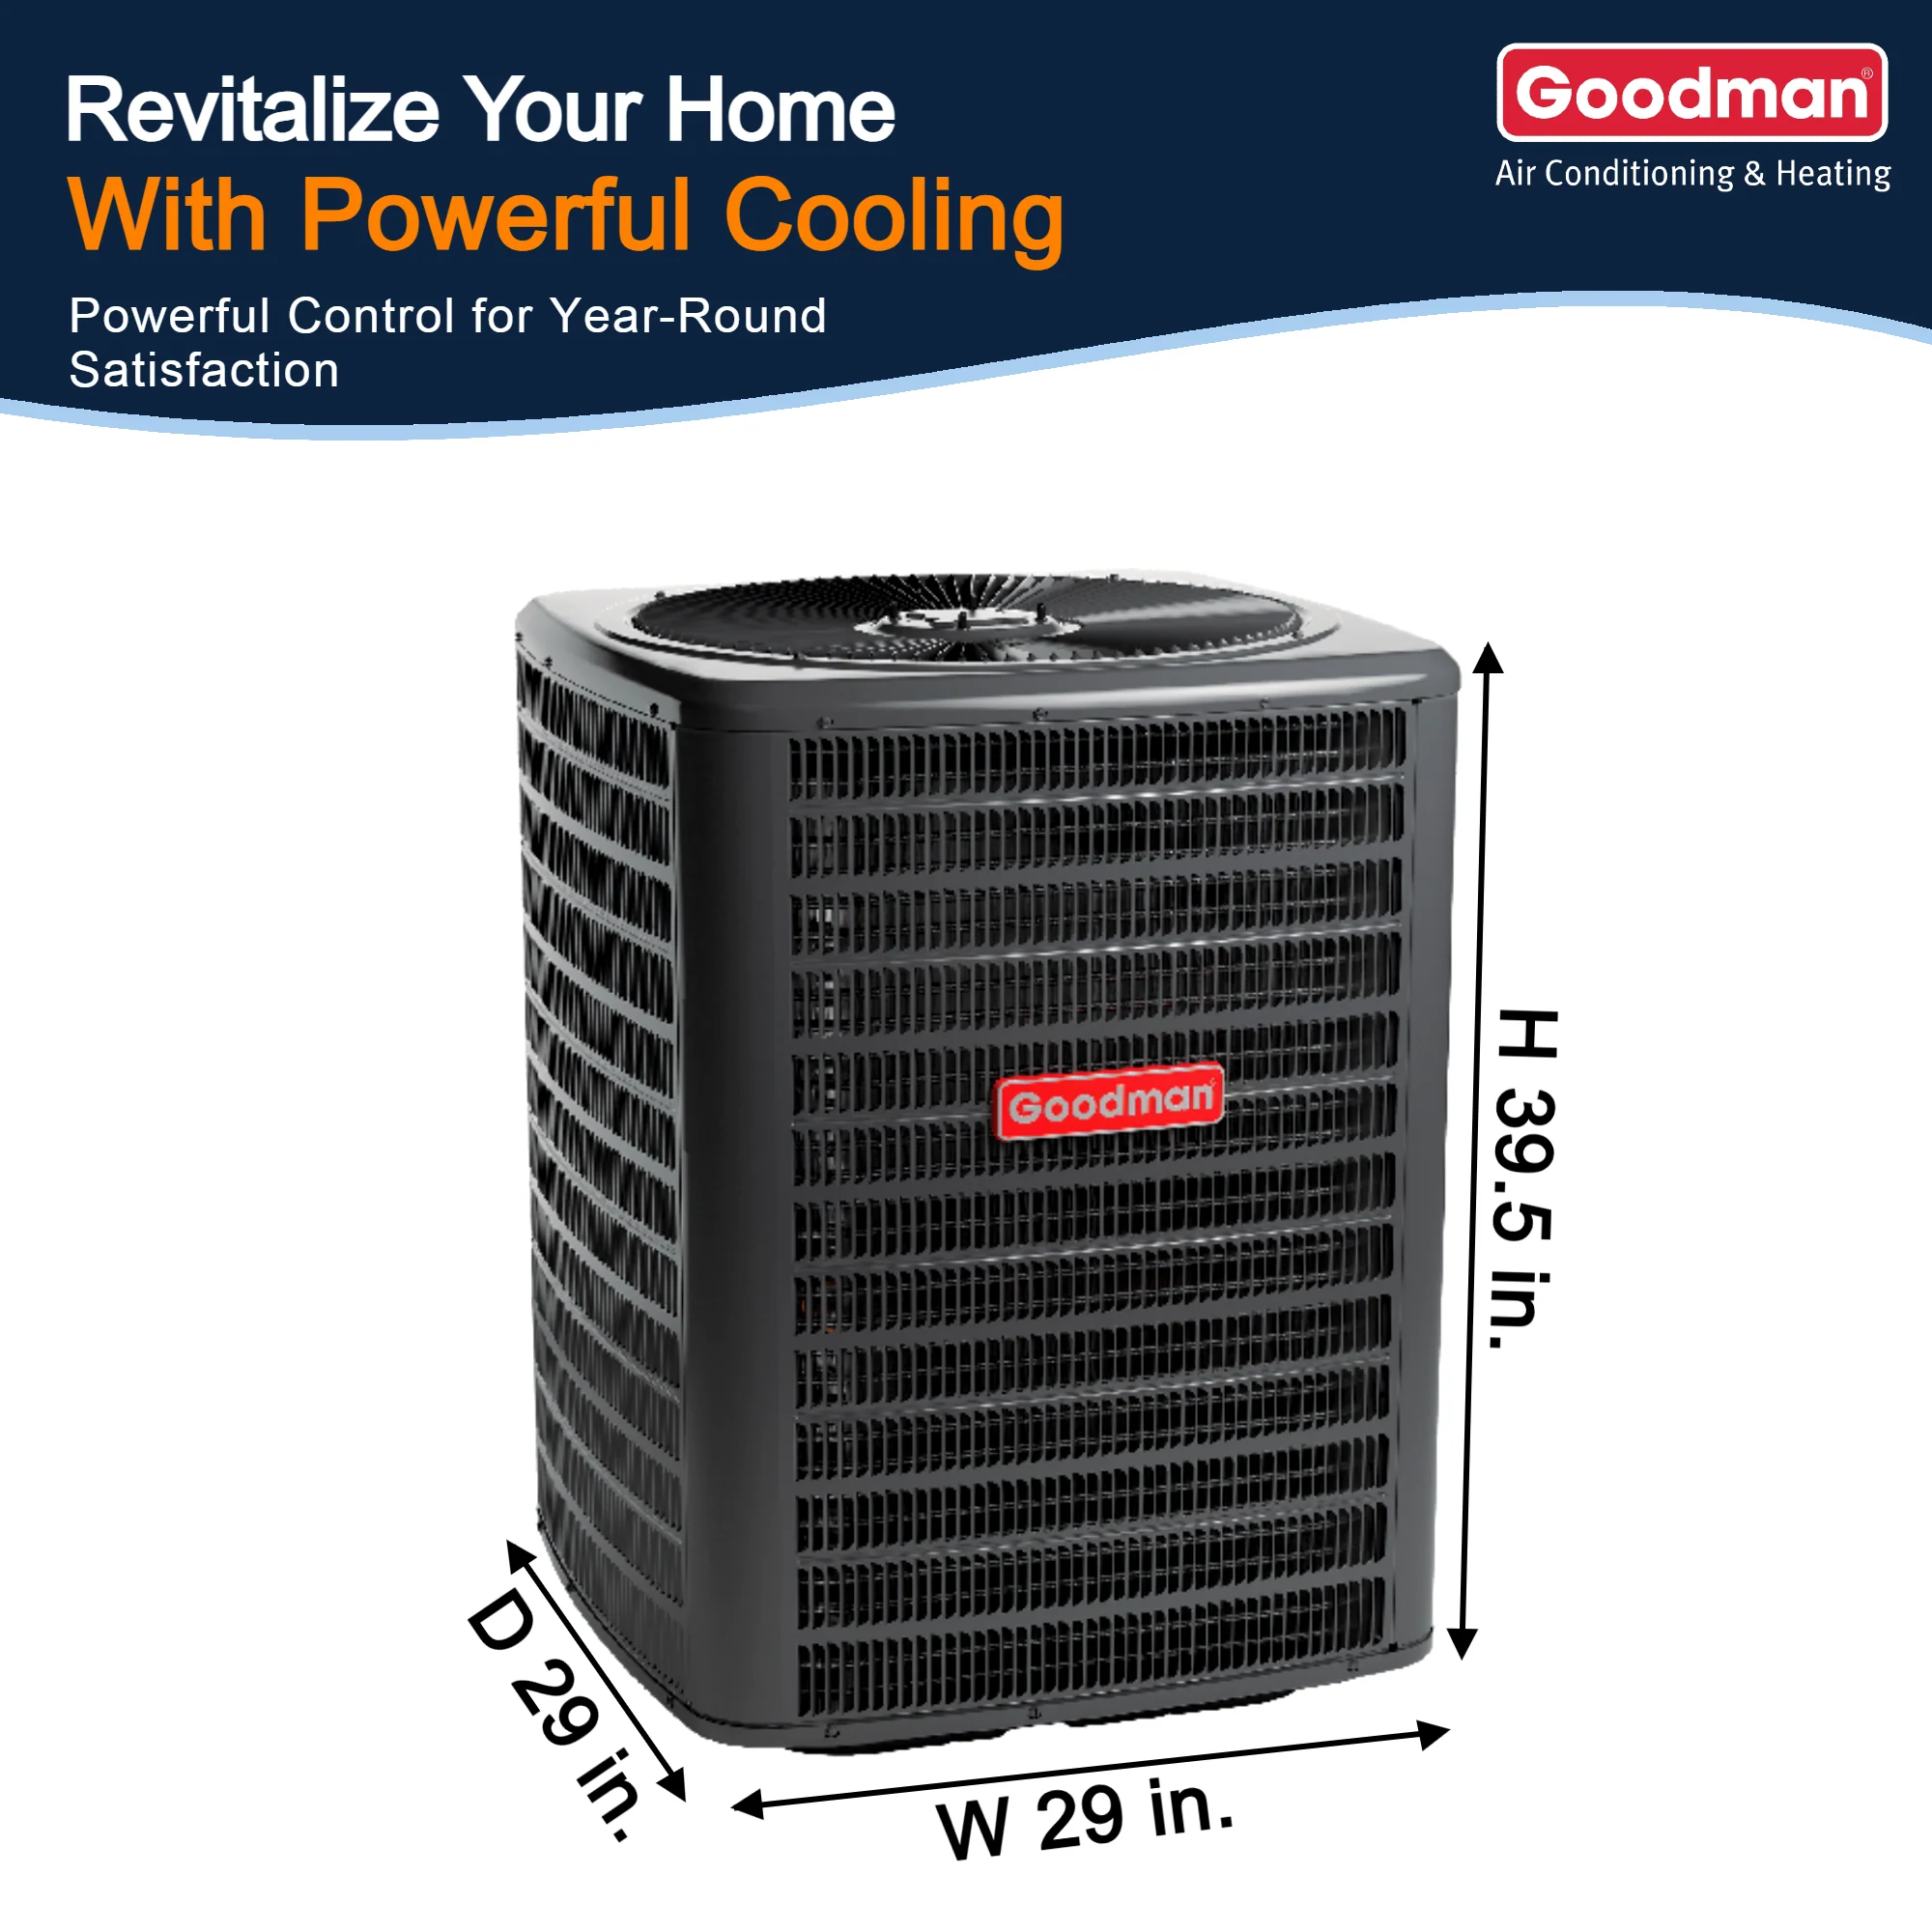
The minimum required efficiency depends on where you live. In northern regions, the minimum for central AC is typically 13.4 SEER2. In the southern and southwest regions, most systems under 45,000 BTU must meet 14.3 SEER2. A good infographic makes this obvious so you don’t chase models that don’t meet your local code. If you manage properties in multiple states, a regional callout or small US map in the visual is a lifesaver. Remember: minimum doesn’t mean best value it just means “allowed.” Climate, hours of use, and power rates can make stepping up a tier (say, from 14.3 to 16 or 18 SEER2) a smart play. When you’re ready to shop within compliant options, browse high-efficiency R-32 systems at The Furnace Outlet start with R-32 air conditioner condensers.
SEER2 Tiers and What They Mean for Your Bills
Here’s the kind of tier snapshot you’ll see in a strong infographic (3-ton example, annual cost estimate):
-
13.4 SEER2 (Minimum): ~$1,200 ($0 savings baseline)
-
14.3 SEER2 (Good): ~$1,125 ($75 savings)
-
16.0 SEER2 (Better): ~$1,012 ($188 savings)
-
18.0 SEER2 (High Efficiency): ~$900 ($300 savings)
-
20.0 SEER2 (Very High): ~$810 ($390 savings)
-
22.0 SEER2 (Premium): ~$736 ($464 savings)
Two takeaways:
-
Savings scale with use. If you run the system longer (hotter climate, big household), higher tiers pay back faster.
-
There’s a sweet spot. Many homes land on 16–18 SEER2 because the upfront cost is reasonable and the yearly savings are meaningful. Use the infographic’s 20-year view to see compound value those $300/year savings at 18 SEER2 can exceed $6,000 before you factor in rate hikes.
SEER2 vs. System Type: Split, Packaged, Ductless, Heat Pump
SEER2 is one lens; system type is the other. A quality infographic should point you to the right category:
-
Split systems (condenser + coil/air handler): The most common path, wide range of SEER2 options.
-
Ductless mini-splits: Great for additions, rentals, or no-duct homes. High efficiency, excellent zoning.
-
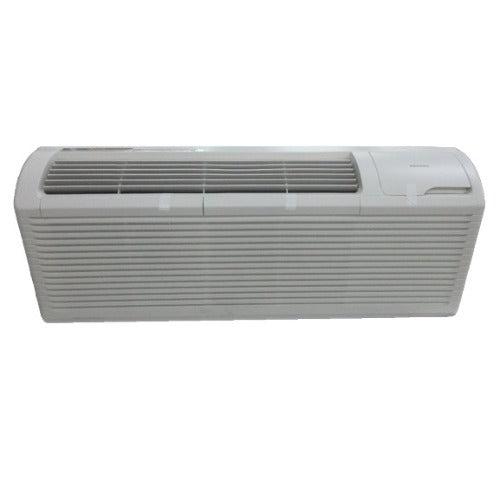
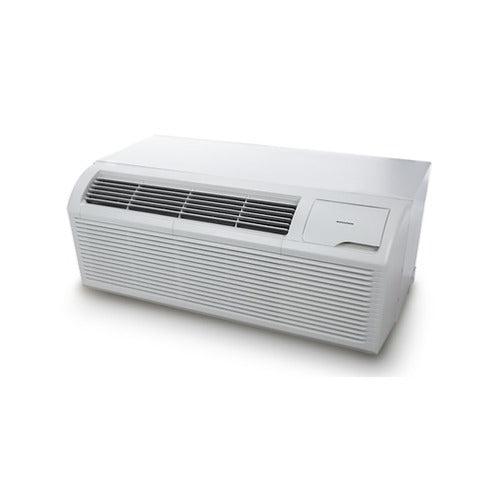
Packaged units: Everything in one outdoor cabinet—common on rooftops or tight yards.
-
Heat pumps: Heating + cooling with strong efficiency. Ideal for many regions; pair with electric or dual-fuel setups.
Your infographic should hint at which type fits your home and climate, so you’re not just chasing a number.
Beyond Efficiency: Reliability, Comfort, Filtration, Noise
Homeowners don’t buy a SEER2 number they buy fewer repairs, quieter nights, and steadier room temps. That’s why top infographics connect SEER2 to broader decision factors:
-
Reliability & warranty expectations (fewer emergency calls)
-
Comfort (better airflow, tighter temperature swings, humidity control)
-
Air quality (filtration options, coil cleanliness, drain design)
-
Noise (outdoor dB ratings matter in tight neighborhoods)
-
Controls (thermostat features, zoning, app support)
If those boxes aren’t addressed in the visual, add a quick checklist for your installer. Pairing the right air handler, filter rack, and accessories matters as much as the condenser. You can shop compatible accessories and line sets at The Furnace Outlet: accessories.
Repair or Replace? Use a Simple Decision Path
A decision tree turns stress into steps. Walk through these branches:
-
Age: Over 10–15 years? Newer SEER2 equipment usually wins on operating cost and comfort.
-
Repairs: Two major repairs in 24 months or a single repair >25% of replacement cost? Replacements are often smarter.
-
Bills: Noticeably rising summer bills usually point to declining efficiency or duct issues.
-
Comfort: Hot/cold rooms, long runtimes, or short cycling indicate sizing or airflow problems.
If two or more branches point to replace, start pricing options. Need help translating your house into the right tonnage and type? Use the quick Sizing Guide.
Running the Numbers: Payback and 20-Year Value
Here’s how we coach customers to use the infographic math:
-
Yearly savings: Move from the minimum to a higher tier (e.g., 13.4 → 18 SEER2) and use the chart’s $300/year estimate for a 3-ton home with typical use.
-
Payback: Divide the price difference between the two systems by the annual savings. If the jump to 18 SEER2 adds $1,500 installed and saves $300/year, payback is ~5 years.
-
Long-term view: Over 20 years, $300/year is $6,000 (not counting rate increases).
-
Financing: If you spread the upgrade cost with affordable terms, monthly savings can help offset the payment. See HVAC Financing options here: Financing.
This is why the 16–18 SEER2 band often emerges as the value sweet spot for many homes.
From Infographic to Shortlist: Your Next Three Moves
Turn the visual into action with three practical steps:
-
Set your floor: Confirm your regional minimum (13.4 or 14.3 SEER2).
-
Pick a target tier: Use the savings table to choose 16, 18, or higher based on hours of use and energy rates.
-
Match the system type: Ducted split, ductless, or packaged—use your home’s layout and goals to decide.
Then build a shortlist from compatible, in-stock equipment. If you want a second opinion, the Help Center and Design Center are handy next stops: Design Center.
Tips
Use local minimums as your baseline: 13.4 (North) or 14.3 (South/Southwest).
-
16–18 SEER2 often hits the best cost-to-value ratio for typical homes.
-
Compare annual costs and 20-year savings—not just the sticker price.
-
If the system is 10–15 years old or needs frequent repairs, price a replacement.
-
Pair equipment with the correct air handler, coil, and line set for real-world efficiency.
-
Ask about warranty, noise, and controls (thermostat, zoning) during quotes.
-
If cash flow is tight, look at Financing and weigh savings vs. payments.

