SEER2 Efficiency Breakdown: How Much You Actually Save
Let’s cut the marketing fluff.
Let’s ignore the brochure promises.
Let’s stop pretending that “higher SEER2 = magic” without showing actual dollars.
I’m Data Jake, and today you’re getting the full 3,000-word breakdown of SEER2 efficiency airflow—what it really means, how much it saves, where the numbers come from, how R32 changes the equation, and whether the upgrade from SEER to SEER2 really matters for YOUR electric bill.
This guide covers:
-
Hourly cost of running your AC
-
Yearly energy-use charts for different SEER2 ratings
-
SEER vs SEER2 explained (why test methods changed)
-
ROI timeline for upgrading to higher efficiency
-
R32’s measurable efficiency boost
-
What actually determines your savings
-
Why your ductwork and static pressure matter as much as SEER2
If you want REAL data—not wishful thinking—you’re in the right place.
1. What SEER2 Actually Means (The Clean, Data Jake Explanation)
SEER2 = Seasonal Energy Efficiency Ratio 2, the new federally mandated testing standard beginning in 2023.
SEER2 = BTUs of cooling delivered ÷ watt-hours consumed
But compared to the old SEER:
-
SEER was tested with 0.1" external static pressure
-
SEER2 is tested with 0.5" static pressure
-
Meaning SEER2 = more realistic real-world number
Jake’s Summary:
SEER was a fantasy rating.
SEER2 is the real-world version that considers duct resistance and blower load.
2. SEER vs SEER2: How Much Lower Are SEER2 Ratings?
The conversion is roughly:
SEER2 = SEER × 0.95 for most systems
…but for some systems, it’s closer to 10–12% lower.
Example:
| Old SEER | New SEER2 Equivalent |
|---|---|
| 14 SEER | 13.4 SEER2 |
| 15 SEER | 14.3 SEER2 |
| 16 SEER | 15.2 SEER2 |
| 18 SEER | 17.0 SEER2 |
Why the drop?
Because SEER2 acknowledges:
-
Real duct leakage
-
Real static pressure
-
Real filter resistance
-
True operating wattage
SEER2 is much harder to “game.”
3. Cost Per Hour Breakdown: How Much Your AC Really Costs to Run
Let’s calculate for a 3-ton system (36,000 BTU capacity).
Formula
Electrical cost per hour = (BTU ÷ SEER2) × cost per kWh
Assume average electricity rate: $0.14/kWh
(You can update this for your state—California and New England pay FAR more.)
3.1 Cost Per Hour by SEER2 Level
13.4 SEER2 (entry level)
36,000 ÷ 13.4 = 2.69 kWh
Cost per hour ≈ $0.38
14.3 SEER2
36,000 ÷ 14.3 = 2.51 kWh
Cost per hour ≈ $0.35
15.2 SEER2
36,000 ÷ 15.2 = 2.37 kWh
Cost per hour ≈ $0.33
17.0 SEER2
36,000 ÷ 17.0 = 2.12 kWh
Cost per hour ≈ $0.30
Data Jake Reality Check:
The hourly difference between low-end and high-end is only 8–12 cents per hour.
But over hundreds of hours per year, it adds up.
Electricity cost references:
US_Energy_Prices
4. Yearly Energy Use Charts (SEER2 vs Annual Cost)
Assume average cooling demand of 1,200 hours per year
(Varies by climate—Florida may hit 2,000+, Minnesota may hit 500.)
Annual Cooling Cost Comparison
| SEER2 Rating | Cost/Hour | Annual Cost |
|---|---|---|
| 13.4 SEER2 | $0.38/hr | $456/year |
| 14.3 SEER2 | $0.35/hr | $420/year |
| 15.2 SEER2 | $0.33/hr | $396/year |
| 17.0 SEER2 | $0.30/hr | $360/year |
Yearly Savings vs 13.4 SEER2:
-
14.3 SEER2 → Saves $36/year
-
15.2 SEER2 → Saves $60/year
-
17.0 SEER2 → Saves $96/year
5. Climate-Based Energy Use (Your Location Changes Everything)
Cooling demand varies dramatically by climate zone.
Annual Cooling Hours by Zone (Approx.)
| Zone | Region Examples | Cooling Hours |
|---|---|---|
| 1 | FL, TX Gulf | 2,000–2,400 hrs |
| 2 | GA, AL, AZ | 1,600–2,000 hrs |
| 3 | NC, TN, MO | 1,200–1,500 hrs |
| 4 | VA, CO, KS | 900–1,200 hrs |
| 5 | MI, PA, OR | 600–900 hrs |
| 6–7 | MN, ND, ME | 350–600 hrs |
Climate data reference:
NOAA_CDD_Data
Jake’s Conclusion:
Higher SEER2 matters most in southern climates.
In northern states, payback takes longer.
6. ROI Timeline for Upgrading SEER2
Let’s assume:
-
Price difference between 13.4 SEER2 and 17 SEER2 system = $1,000–$1,800
-
Annual savings = $50–$150, depending on the climate
ROI Calculation Examples
Mild Climate (900 hrs)
Savings ≈ $50/year
ROI = 20 years → Not worth it.
Mixed Climate (1,200 hrs)
Savings ≈ $75/year
ROI = 13–15 years → Borderline.
Hot Climate (2,000 hrs)
Savings ≈ $150/year
ROI = 7–10 years → Worth it.
More ROI calculators:
AFUE_SEER_Calculator
Data Jake’s Rule:
If you live in the South, upgrade.
If you live in the North, invest in insulation or duct fixes first.
7. The R32 Efficiency Boost (Why New Systems Get Better Numbers)
R32 isn’t just a new refrigerant—it changes performance.
Compared to R410A:
R32 Advantages
✔ 10–12% better heat transfer
✔ Lower refrigerant charge weight
✔ More stable suction pressure
✔ Better high-temperature performance
✔ Better humidity removal
✔ Lower compressor watt draw
Refrigerant data:
R32_Technical_Data
This translates into:
-
Higher SEER2 ratings
-
More stable part-load efficiency
-
Better real-world performance when static pressure is high
-
Improved seasonal efficiency even when ducts are mediocre
Jake’s Take:
A 14.3 SEER2 R32 system may outperform a 15.2 SEER2 R410A unit in real conditions.
That’s not theory—it’s field reality.
8. Why Your Real Savings May Differ From SEER2 Ratings
SEER2 is not a guarantee—it’s a best-case scenario.
Your real savings depend on:
8.1 Ductwork Static Pressure
High static kills SEER2.
It can drop efficiency by 10–25%.
Airflow reference:
Ductwork_Airflow_Issues
8.2 Filter Choice
Cheap high-MERV filters choke airflow and destroy efficiency.
Filter info:
MERV_Ratings_Guide
8.3 Thermostat Behavior
Aggressive cycling or high fan speed reduces humidity removal → more runtime → more electricity.
8.4 Coil Match
A mismatched indoor coil reduces SEER2 performance immediately.
Goodman match tools:
AHRI_Match
8.5 Oversizing
An oversized AC cycles too quickly → destroys SEER2 potential.
Humid home reference:
EPA_Humidity_Control
9. SEER2 Efficiency vs Comfort (Not the Same Thing)
Important truth:
Higher SEER2 ≠ better comfort.
Comfort is determined by:
-
Coil temperature
-
Latent removal
-
Run time
-
Airflow
-
Blower speed
-
System cycling
-
Humidity control
A properly sized 14.3 SEER2 system will beat a poorly sized 17 SEER2 unit every time.
10. Data Jake’s Final Verdict: Is SEER2 Worth Paying For?
YES — If you live in:
-
Florida
-
Texas
-
Georgia
-
Alabama
-
Arizona
-
Southern California
-
Gulf states
High cooling hours = fast ROI.
MAYBE — If you live in:
-
Virginia, Tennessee, Kentucky
-
Kansas, Missouri
-
Colorado, Utah
ROI ~ 10–14 years.
NO — If you live in:
-
Michigan
-
Wisconsin
-
Oregon
-
Washington
-
Pennsylvania
-
New England
-
Minnesota
ROI = 15–25 years unless electricity prices are skyrocketing.
But what about R32?
R32 narrows the ROI gap because:
-
It boosts SEER2 performance
-
It stabilizes efficiency under real-world duct static
-
It delivers better humidity control
-
It lowers compressor watt draw
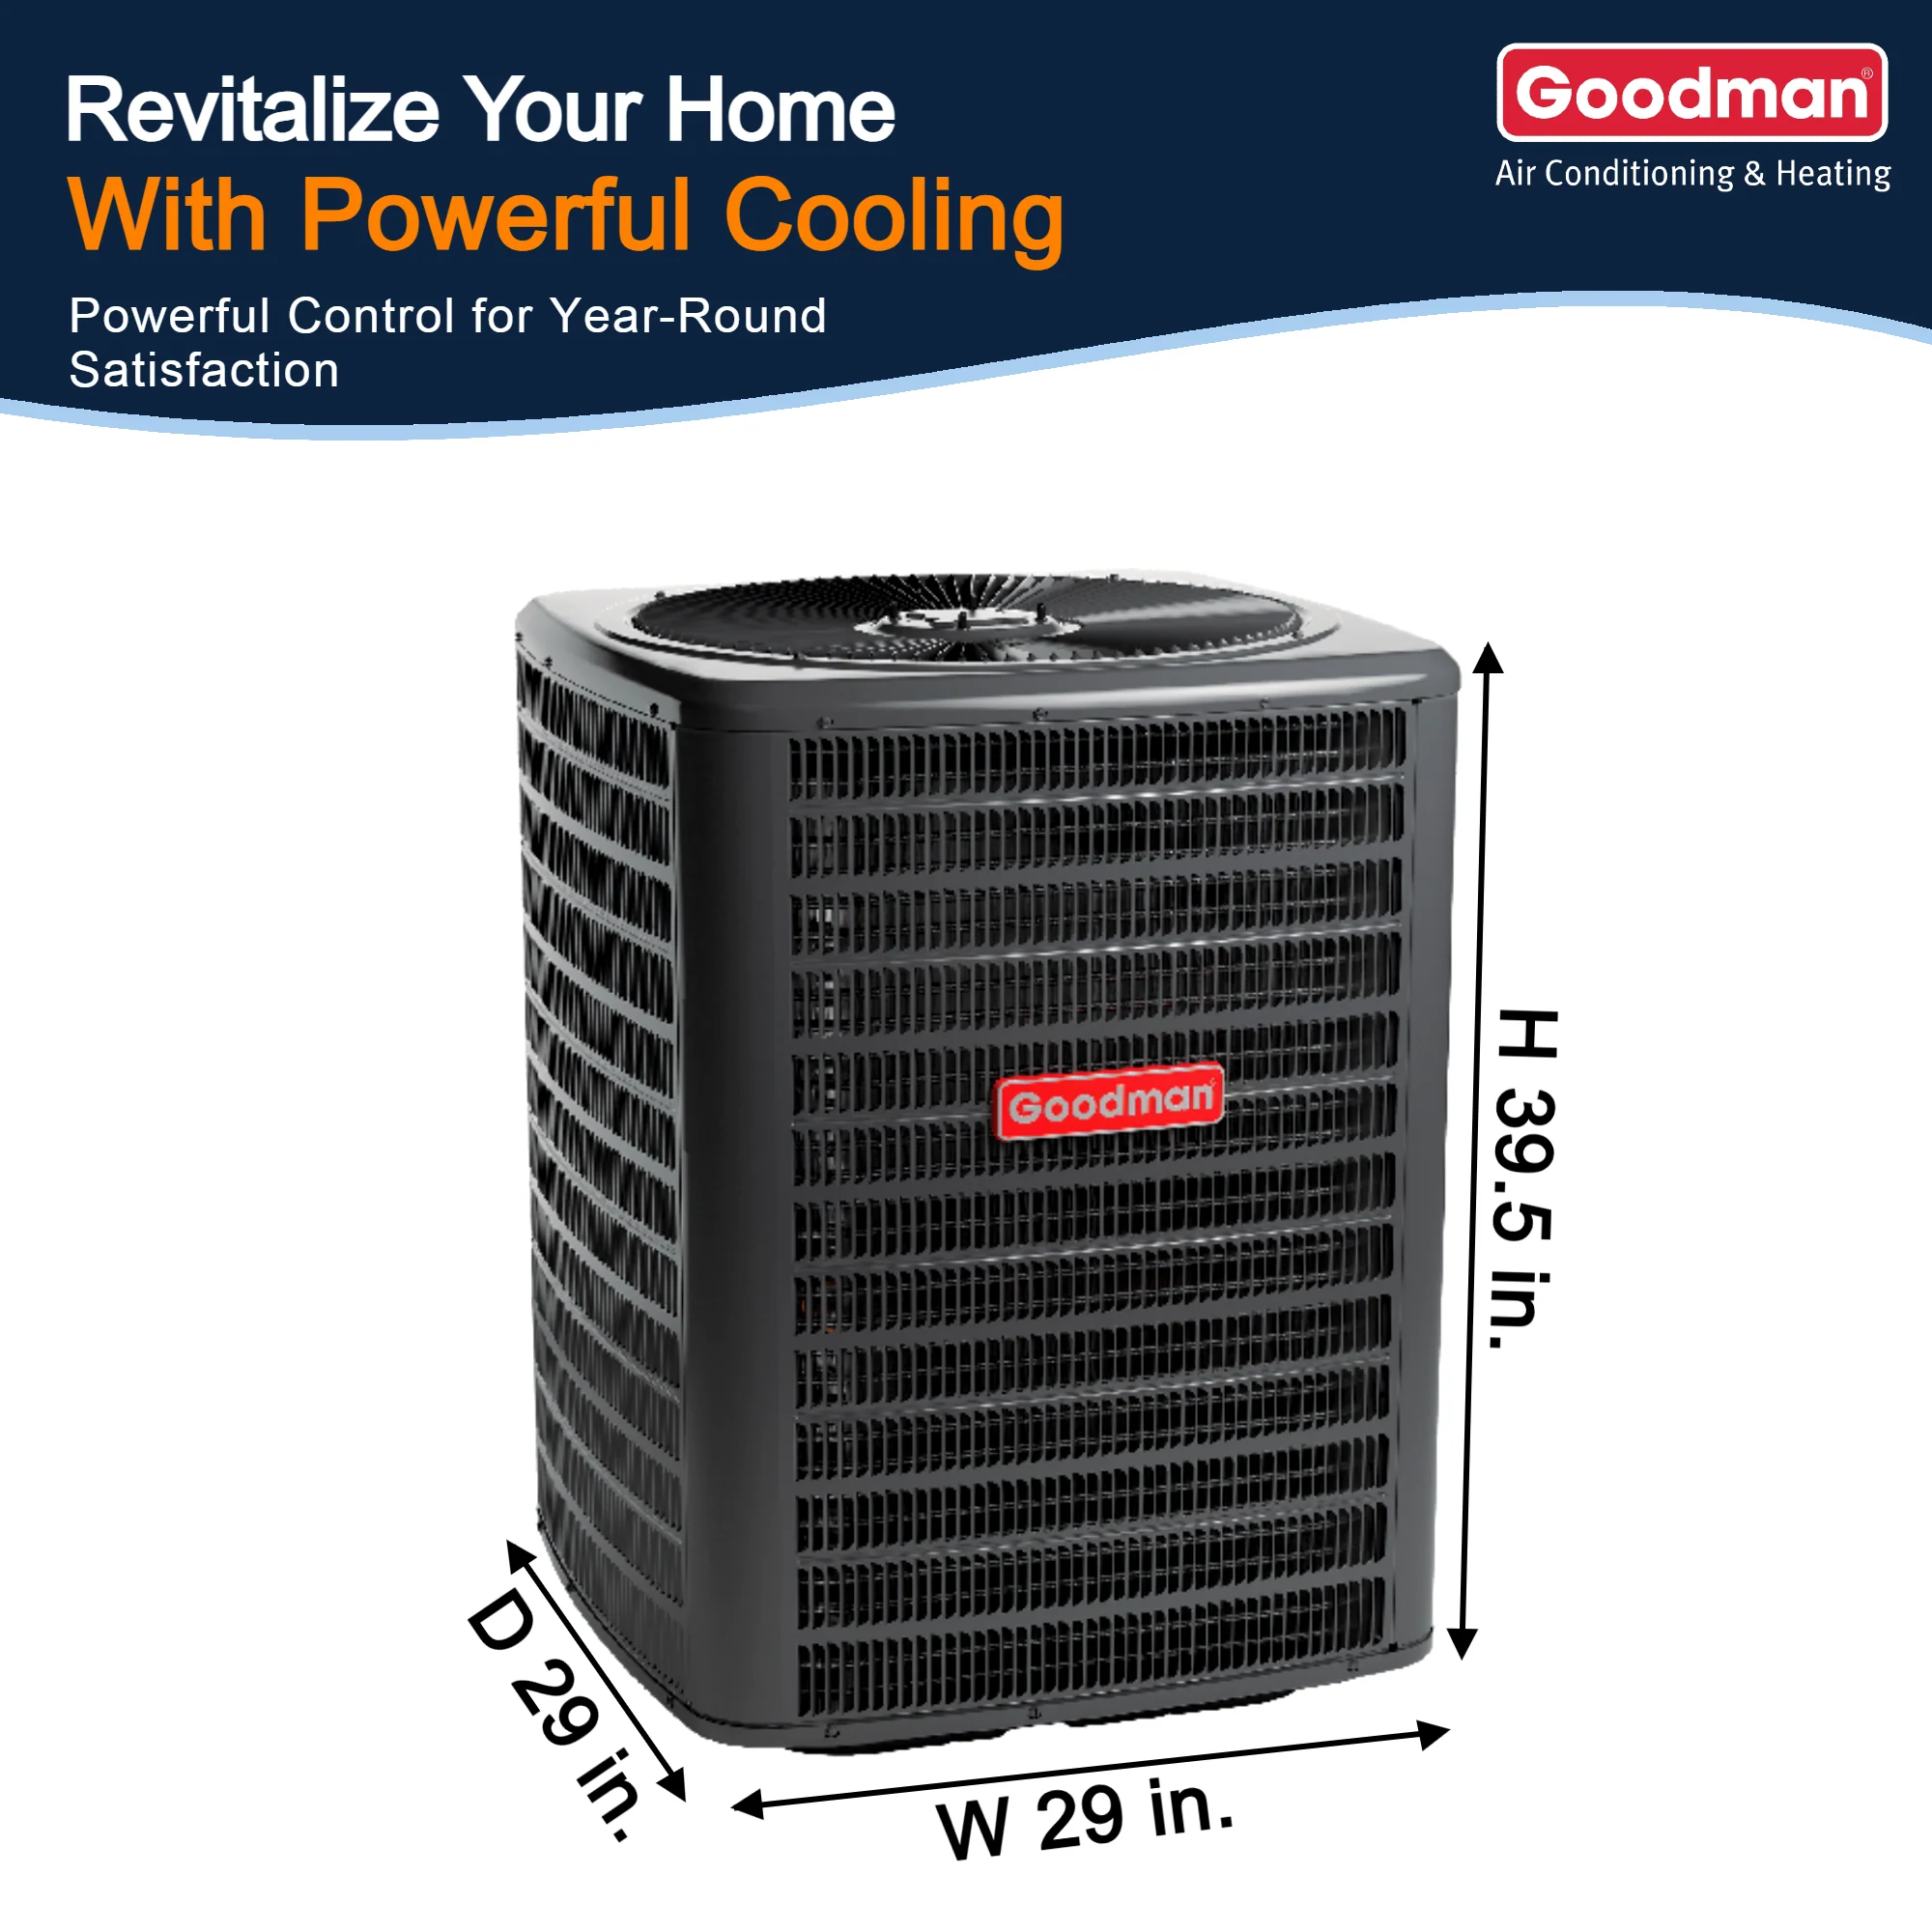
Meaning a 14.3 SEER2 R32 Goodman performs closer to a 15.2–16 SEER2 R410A unit.
In the next blog, you will learn about Noise & Comfort Performance: What to Expect Indoors & Outdoors