
These charts are more than technical references—they’re diagnostic roadmaps that help technicians identify inefficiencies, detect problems early, and ensure systems run safely and smoothly. Especially when handling mildly flammable refrigerants like A2Ls, mastering P-T charts is key to elevating both safety and system performance.
Let’s explore how these tools are reshaping HVAC diagnostics and what professionals need to know to stay ahead.
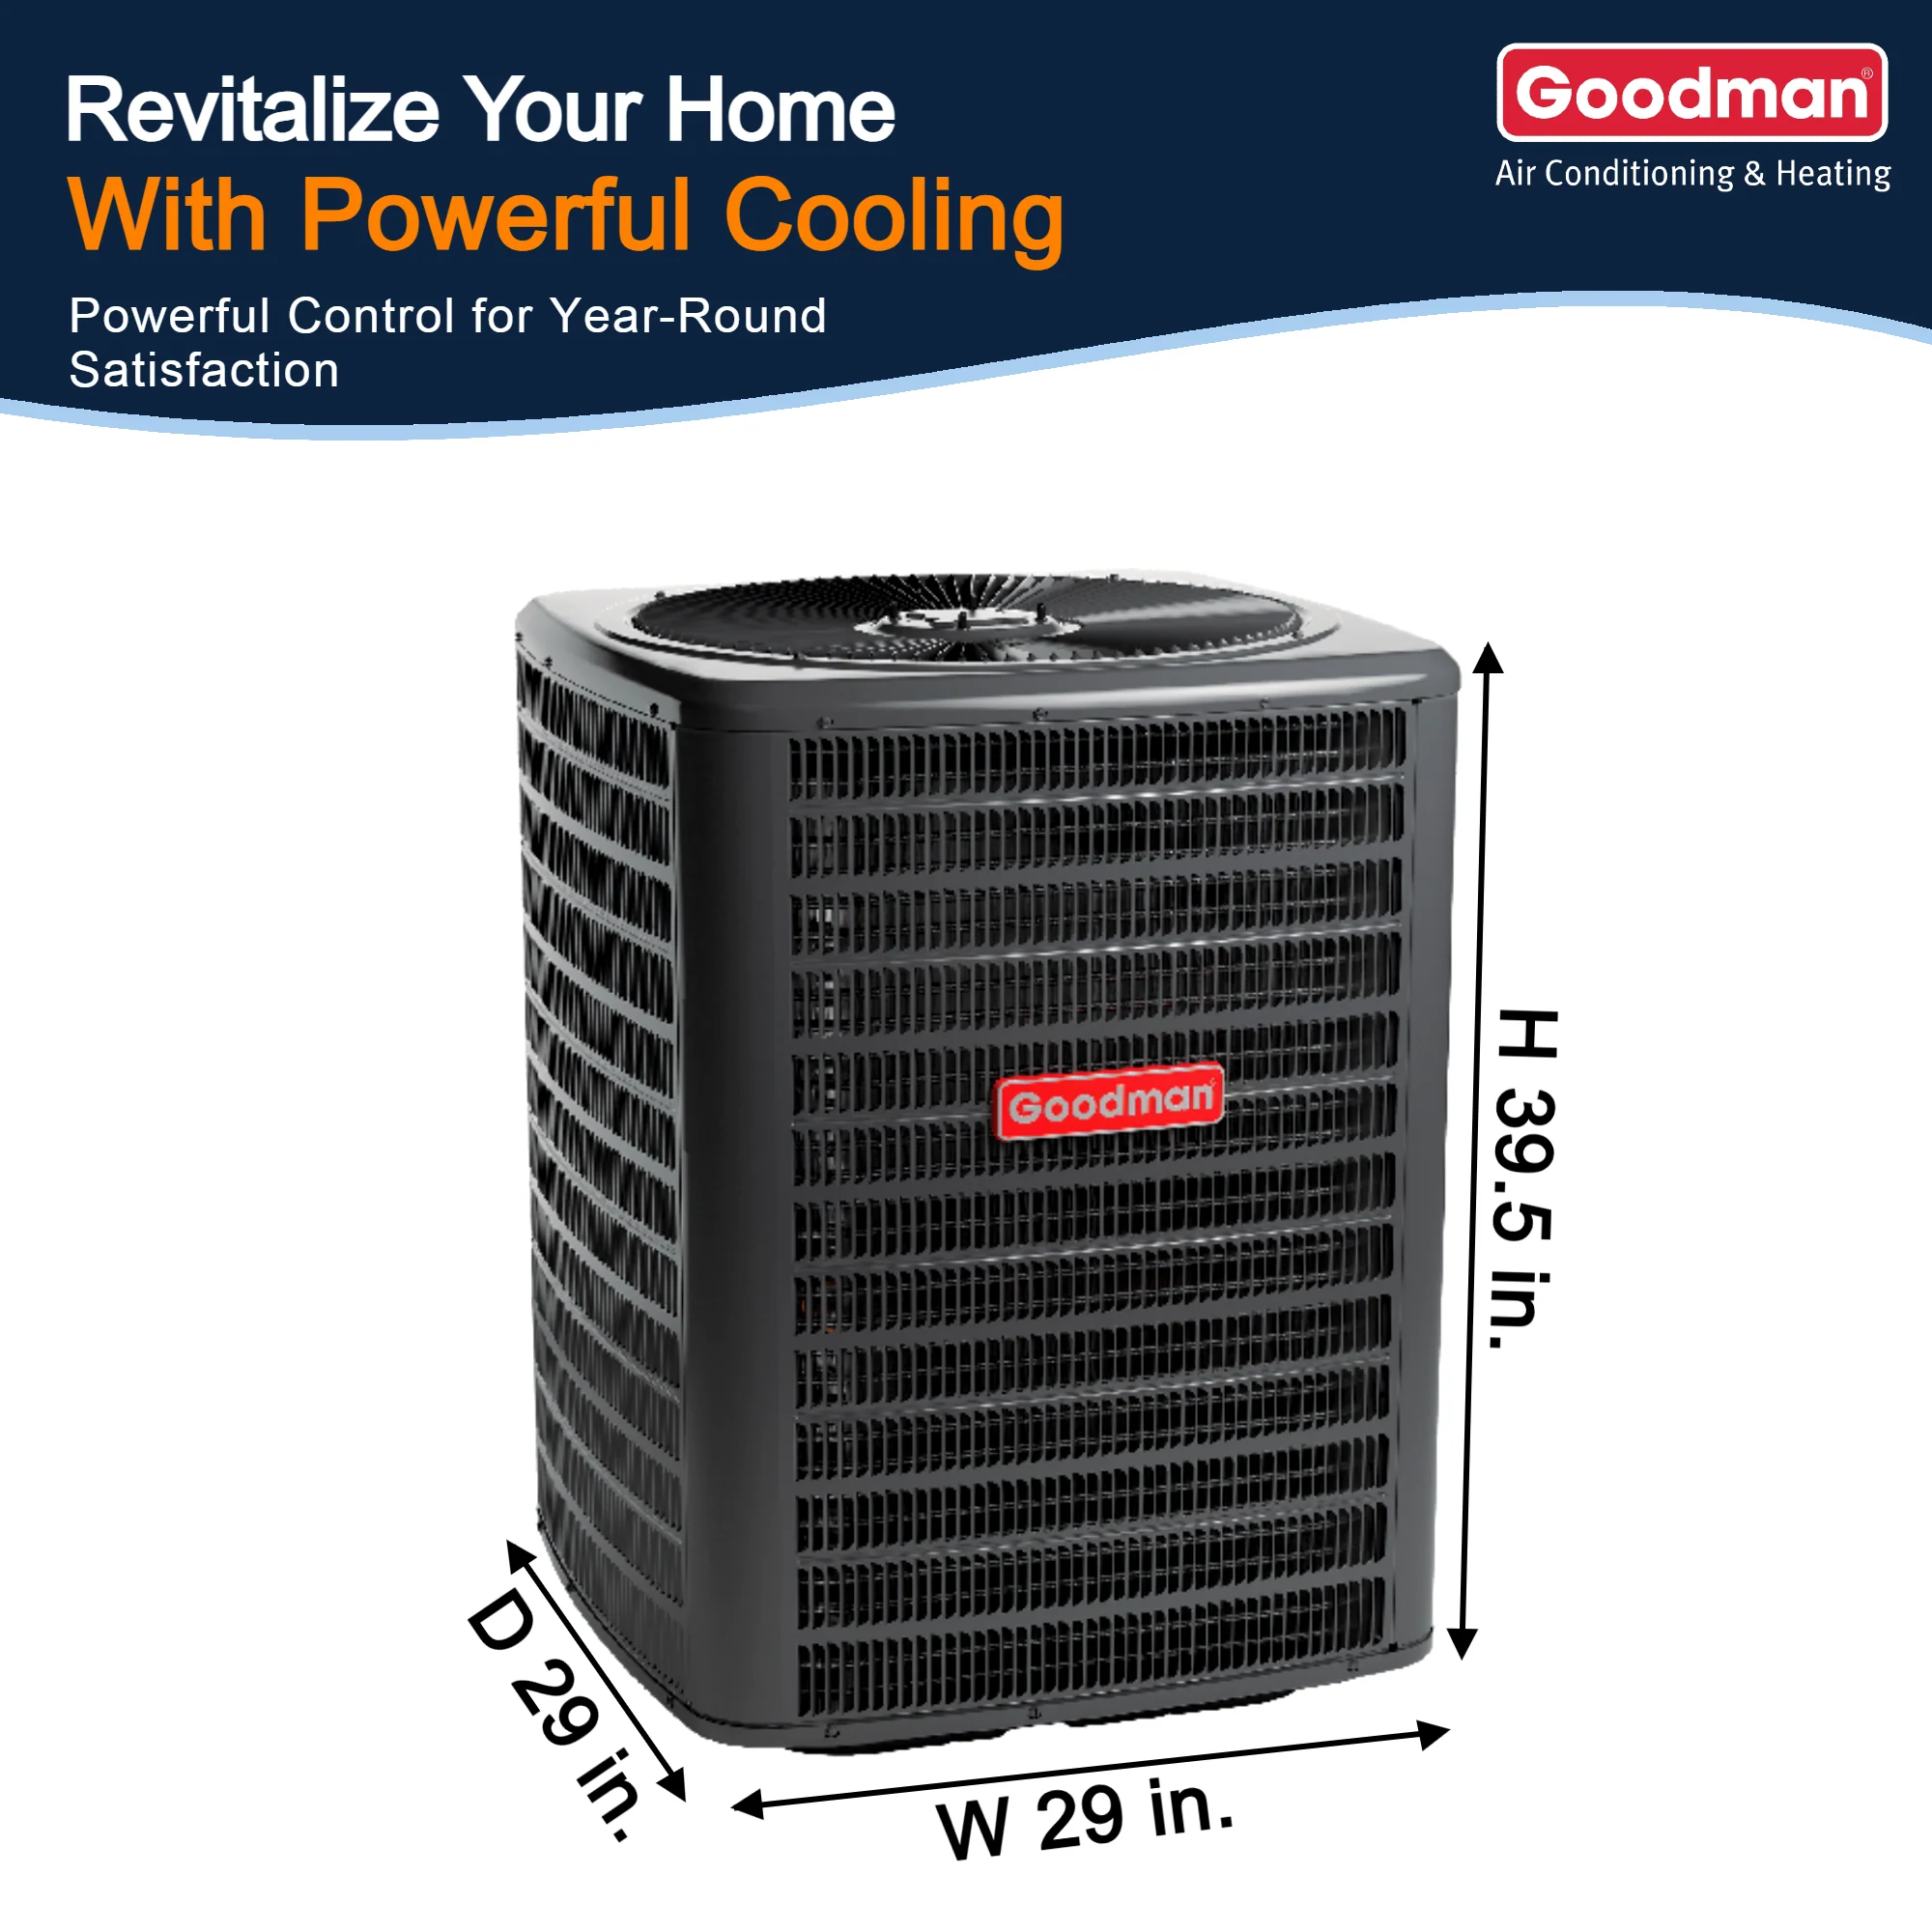
New to A2Ls? Explore R-32 packaged air conditioners designed for efficiency and compliance.
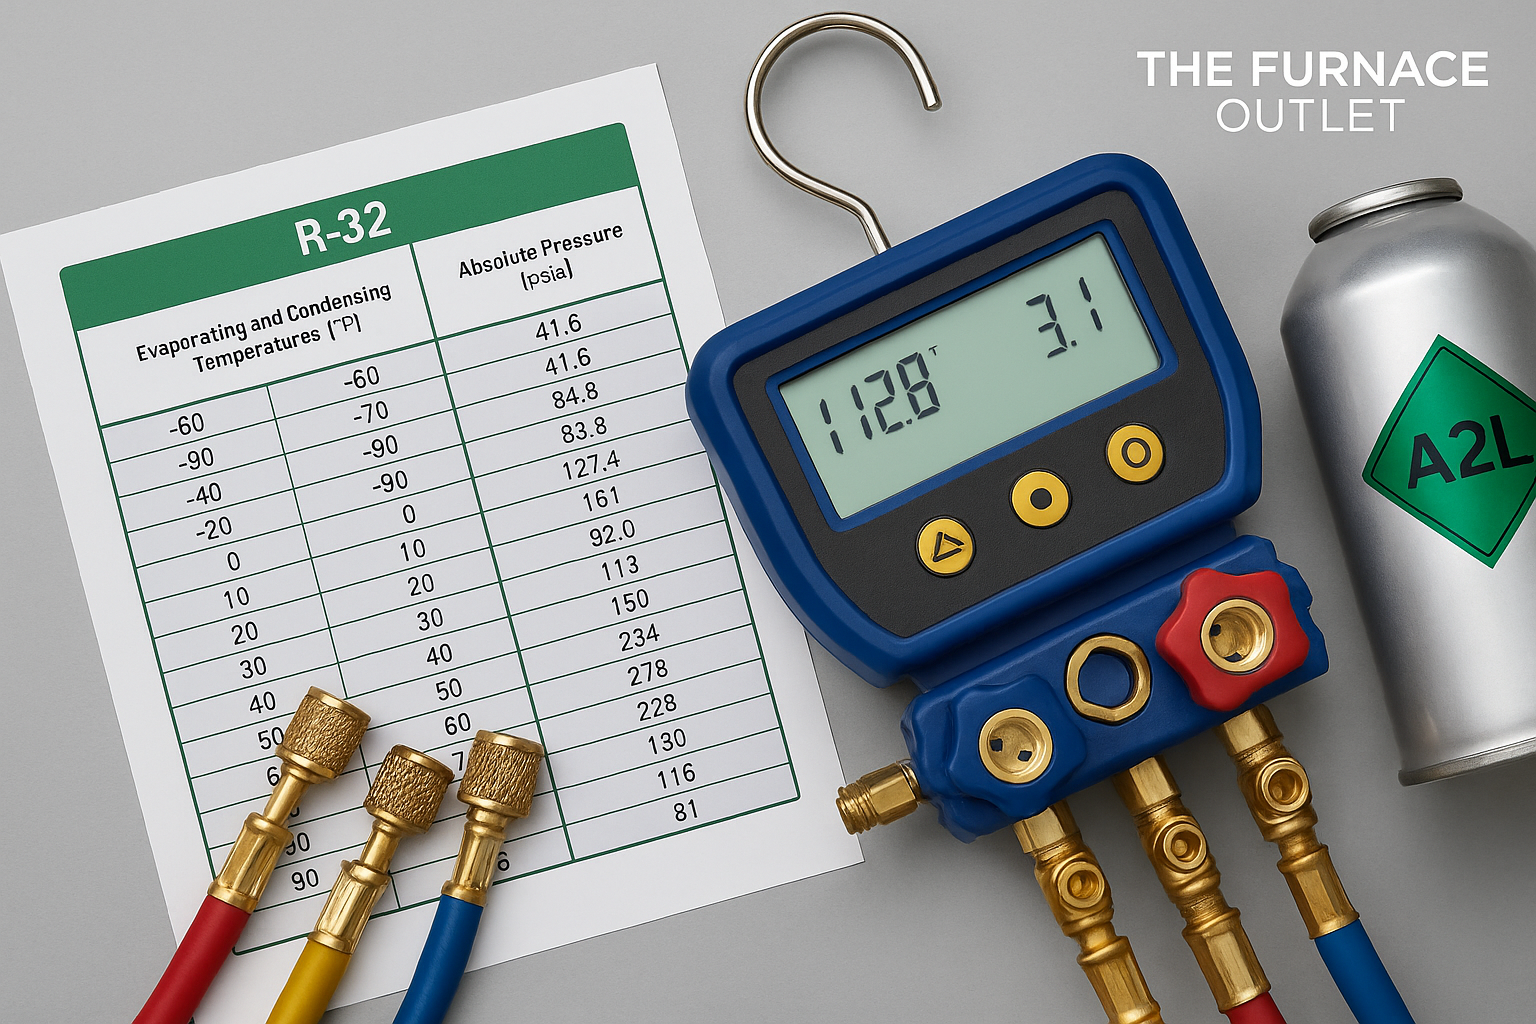
What Pressure-Temperature Charts Really Tell You

Every refrigerant has its own unique thermodynamic properties, meaning each comes with its own P-T chart. For A2L refrigerants, this becomes even more critical. Because of their mild flammability, precise control over system conditions is essential—not just for performance, but also for safety.
Used properly, these charts help techs identify abnormal readings that could point to deeper system issues, such as leaks, overcharges, or faulty components. In short, P-T charts serve as both a diagnostic tool and a safety checkpoint.
Diagnosing System Issues with Confidence

Optimize your diagnostics with R-32 AC and gas furnace systems built for balanced performance.
For instance:
-
High pressure at normal temperature could mean there’s a blockage or too much refrigerant.
-
Low pressure at expected temperature might indicate a leak or an undercharged system.
But these charts aren’t just for fixing what's broken. They’re also valuable for preventative maintenance. Routine checks using P-T charts can reveal trends and anomalies early, helping avoid expensive repairs and downtime. This makes them indispensable for long-term system reliability.
Field data on A2L refrigerant performance reinforces their role in boosting long-term reliability.
Why A2L Refrigerants Are the Future

Key advantages include:
-
Lower Global Warming Potential (GWP): A2Ls significantly reduce a system’s carbon footprint compared to older refrigerants like R-410A.
-
Improved Heat Transfer Efficiency: These refrigerants often allow for smaller charge sizes and faster heat exchange, making systems more energy efficient.
-
Long-Term Sustainability: As regulatory pressures increase, A2Ls provide a path forward that balances performance with compliance.
Despite their classification as “mildly flammable,” A2Ls are considered safe when systems are properly designed and maintained. Understanding how to work with them is becoming an essential skill for the modern HVAC technician.
Safety First: Working Responsibly with A2L Refrigerants

Stay compliant with R-32-compatible accessories like seal kits, sensors, and labeling tools.
Core safety practices include:
-
Ventilation: Always ensure adequate airflow in the workspace to prevent refrigerant buildup.
-
Proper PPE: Use flame-resistant clothing, gloves, and eye protection. Tools should be rated for non-sparking use.
-
Code Compliance: Follow guidance from ASHRAE, EPA, and local building codes regarding allowable charge sizes, system labeling, and equipment design.
With the right procedures and training, HVAC professionals can handle A2L refrigerants confidently and safely, minimizing risks while maximizing system benefits.
Mastering P-T Charts: A Practical Guide

Pair diagnostics with ductless mini-split systems for fast response and real-time readings.
Here’s a simplified process:
-
Identify the refrigerant in use and locate its specific P-T chart.
-
Measure temperature at a key point in the system.
-
Compare pressure readings to the expected value at that temperature.
-
Diagnose deviations. For example, high pressure might indicate overcharging; low pressure could mean a leak or restriction.
Understanding where the refrigerant is in its cycle (liquid or vapor) also helps with assessing subcooling and superheat—two critical metrics for optimizing performance and preventing compressor failure.
For safe operation and proper system identification, accurate refrigerant labeling is also critical—especially in mixed system environments.
Over time, reading these charts becomes second nature and can dramatically improve the accuracy of diagnostics and speed of service.
Diagnosing the Most Common HVAC Problems

-
Refrigerant Leaks: Low pressure and temperature readings that fall below chart values often point to a leak.
-
Overcharge or Undercharge: If pressure is too high or too low for the measured temperature, improper refrigerant levels are likely.
-
Component Failures: Abnormal phase transitions or pressure drops could indicate problems in valves, compressors, or filters.
-
Flow Restrictions: Sudden pressure changes may reveal blockages that reduce system efficiency or cause icing.
Using a P-T chart as a diagnostic benchmark ensures these issues are caught early, addressed accurately, and prevented from recurring.
Keeping HVAC Systems Efficient with A2L Refrigerants

Key efficiency tips:
-
Routine Monitoring: Log system pressure and temperature readings during regular maintenance.
-
Preventative Maintenance: Clean or replace filters, coils, and belts to keep refrigerant flowing freely.
-
Training & Certification: Stay up to date with refrigerant handling certifications and training programs, particularly those focused on A2Ls.
Technicians who combine technical knowledge with proactive habits will be best equipped to maintain high-performance, low-impact HVAC systems for years to come.
What’s Next: Trends in Refrigerant Technology

Top trends to watch:
-
Next-Generation Refrigerants: Even lower-GWP refrigerants are being developed to meet future global climate targets.
-
Smart Systems & IoT Integration: Sensors and analytics now offer real-time system diagnostics and performance optimization.
-
Modular System Designs: Scalable, flexible systems are becoming the standard, particularly in large or complex installations.
To stay competitive, HVAC professionals must stay informed—not just on refrigerants, but also on the digital tools that are transforming system design, monitoring, and maintenance.
Energy-efficient HVAC design with A2Ls is no longer a niche approach—it’s the direction of the entire industry.
Final Takeaway: Precision Meets Performance

When technicians are equipped to read P-T charts and follow best practices, they do more than just fix problems—they prevent them. They also contribute to more sustainable, energy-efficient buildings and safer environments for both workers and occupants.
The HVAC industry is rapidly evolving, and those who embrace these changes—through education, safety, and mastery of diagnostic tools—will lead the way in performance, compliance, and innovation.
Upgrade your system with proven R-32 technology—shop high-efficiency A2L-compatible systems now at The Furnace Outlet.